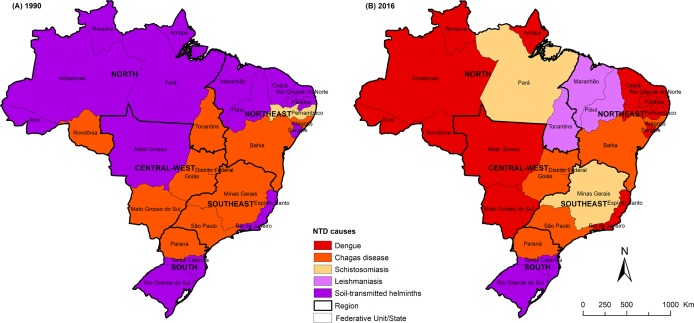
Fig 6.
Spatial distribution of leading causes of total DALYs among all NTDs by state in Brazil for (A) 1990 and (B) 2016. DALYs = disability-adjusted life-years; NTDs = neglected tropical diseases. Choropleth map produced using ArcGIS version 9.3 (Esri, Redlands, CA, USA). Source of shapefile: Brazilian Institute of Geography and Statistics (IBGE in Portuguese; https://mapas.ibge.gov.br/bases-e-referenciais/bases-cartograficas/malhas-digitais.html).

