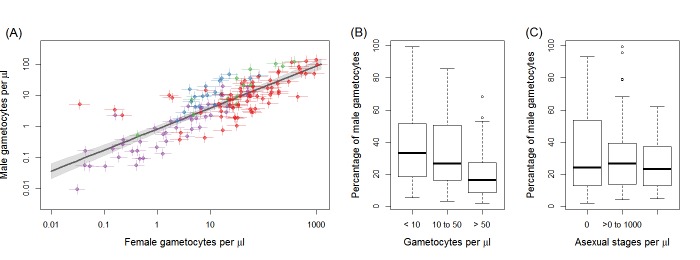
Figure 1. Gametocyte density in natural infections.
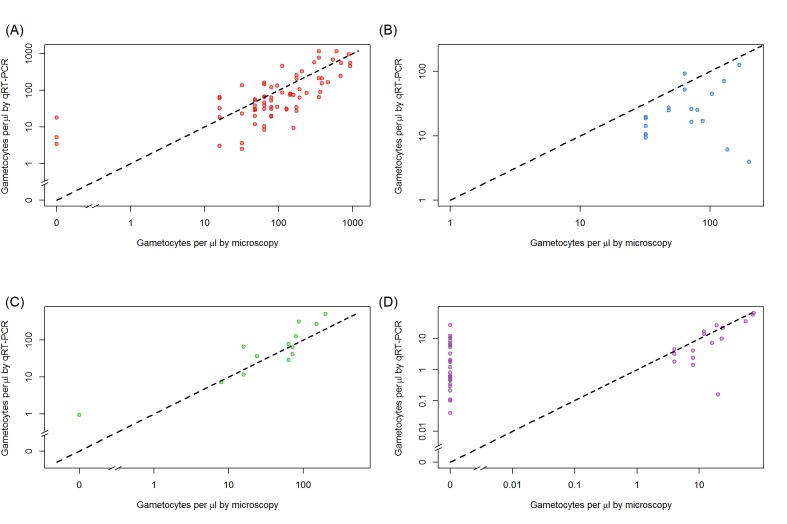
The density of female gametocytes and male gametocytes is presented in panel (A) for samples from Ouelessebougou, Mali (red), Yaoundé, Cameroon (green), Bobo-Dioulasso, Burkina Faso (blue) and Balonghin, Burkina Faso (purple). Female and male gametocyte densities were positively associated (r = 0.79, p<0.001) with the best fit relationship shown by the black solid line (grey shaded area showing 95% the confidence interval around this line). Coloured horizontal and vertical lines indicate Bayesian credible intervals (CIs) around point estimates. The proportion of gametocytes that were male was negatively associated with total gametocyte density (B) but not with asexual parasite density (C). All raw data can be found in Figure 1—source data 1 whilst a description of the relationship modelled in (A) is provided in Figure 1—source data 2. The relationship between gametocyte density as measured by microscopy and PCR is given for each site in Figure 1—figure supplement 1.


