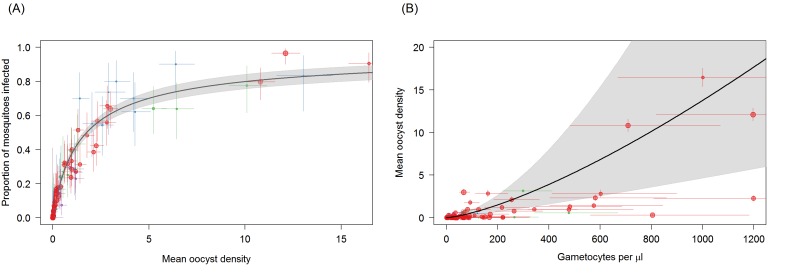
Figure 3. Associations between mean oocyst density; the proportion of mosquitoes that develop oocysts; and gametocyte density.
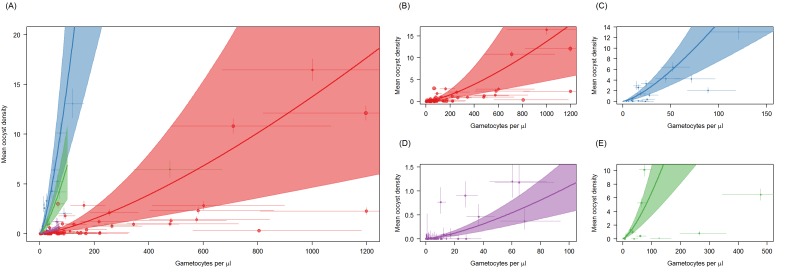
(A) The relationship between mean oocyst density and the proportion of mosquitoes that develop oocysts (red = Ouelessebougou, Mali, green = Yaoundé, Cameroon, blue = Bobo Dioulasso, Burkina Faso, purple = Balonghin, Burkina Faso; point size is proportional to the number of mosquitoes dissected). A Hill function gave the best fit to these data (DIC linear = 1310; power = 602; Hill = 434). (B) The relationship between total gametocyte density and the mean oocyst density in all mosquitoes. The power function gave the best fit to these data (DIC linear = 1042; hyperbolic = 1044; gompertz = 1067; power = 1036); total gametocyte density gave a better fit than only female gametocyte density (best DIC = 1061). Horizontal and vertical lines indicate 95% Bayesian credible intervals (CIs) around point estimates, solid black line indicates the best-fit model with grey shaded area indicates the 95% CI around this line. Like Figure 2A, Panel 3B aids clarity by scaling model and data to the average infectivity of the largest dataset though the raw data and model fits are provided in Figure 3—figure supplement 1.


