. 2018 Jun 5;7:e34467. doi: 10.7554/eLife.34467

Figure 1. A hidden Markov model of ensemble activity during PBEs.

A hidden Markov model of ensemble activity during PBEs. (a) Examples of three PBEs and a run epoch. (b) Spikes during seven example PBEs (top) and their associated (30 state HMM-decoded) latent space distributions (bottom). The place cells are ordered by their place fields on the track, whereas the non-place cells are unordered. The latent states are ordered according to the peak densities of the lsPFs (lsPFs, see Materials and methods). (c) The transition matrix models the dynamics of the unobserved internally-generated state. The sparsity and banded-diagonal shape are suggestive of sequential dynamics. (d) The observation model of our HMM is a set of Poisson probability distributions (one for each neuron) for each hidden state. Looking across columns (states), the mean firing rate is typically elevated for only a few of the neurons and individual neurons have elevated firing rates for only a few states.

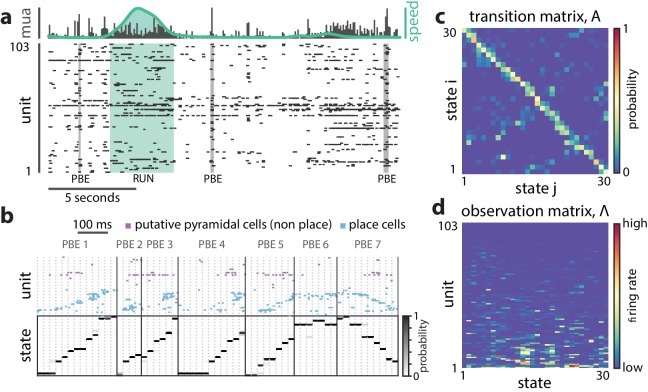
Figure 1.

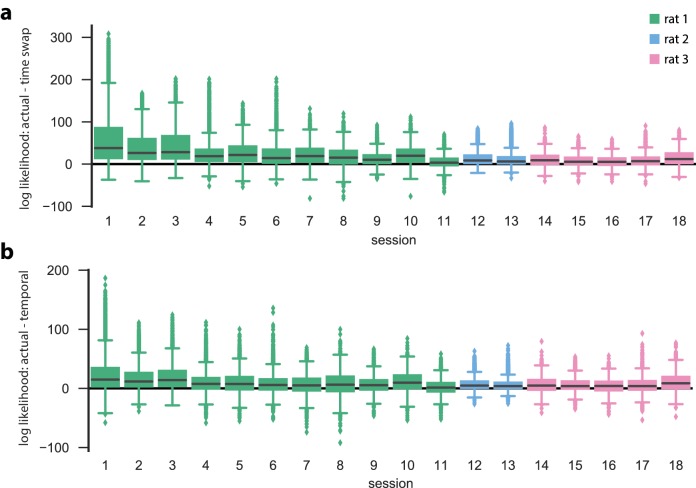
Figure 1—figure supplement 1. Hidden Markov models capture state dynamics beyond pairwise co-firing.

Figure 1—figure supplement 1.

Actual cross-validated test data and surrogate test data evaluated in actual-data-optimized HMMs for all 18 linear track sessions. For each session, we performed five-fold cross validation to score the validation (=test) set in an HMM that was learned on the corresponding training set. In addition, two surrogate datasets of the validation data (obtained by either temporal shuffle or time-swap shuffle) were scored in the same HMM as the actual validation data. k=50 shuffles of each event and of each type were performed. (a) Difference between the data log likelihoods of actual and time-swap surrogate test events, evaluated in the actual train-data-optimized models. (b) Same as in (a), except that the differences between the actual data and the temporal surrogates are shown. For each of the n=18 sessions, the actual test data had a significantly higher likelihood than either of the shuffled counterparts (p<0.001, Wilcoxon signed-rank test). Sessions are arranged first by animal, and then by number of PBEs, in decreasing order.