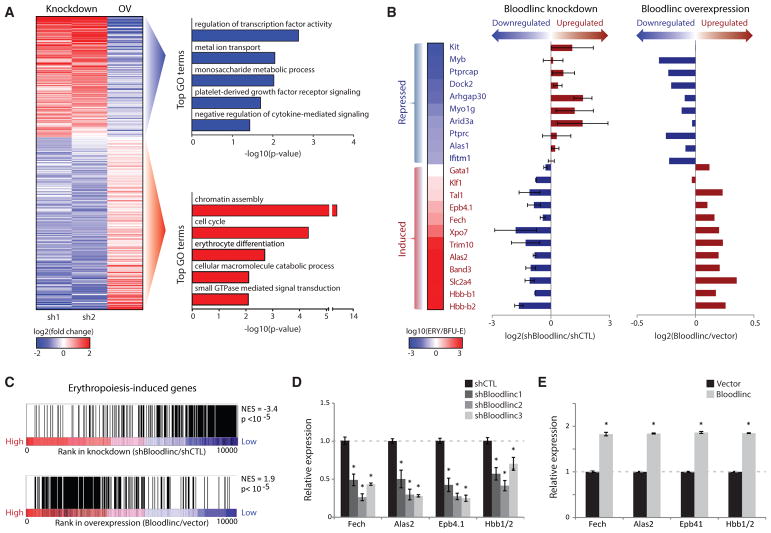
Figure 3. Bloodlinc Modulates the Core Gene Program of Terminal Erythropoiesis.
(A) Left: expression change (log2 fold change over control) of 488 genes differentially and reciprocally regulated upon Bloodlinc shRNA-mediated inhibition or ectopic overexpression (OV) after 24 hr of ex vivo differentiation. Right: top non-redundant gene ontology (GO) biological processes enriched among reciprocally regulated genes.
(B) Bloodlinc modulation impacts erythropoiesis-repressed (top) and erythropoiesis-induced genes (bottom). Expression changes for select genes (left) during normal differentiation is shown as the log10 expression ratio between BFU-Es and TER119+ erythroblasts (ERY). Their expression changes upon Bloodlinc depletion or overexpression (right) are shown as the log2 expression ratio between treated versus control cells. Depletion data are pooled from two separate shRNAs.
(C) Erythropoiesis-induced genes are Bloodlinc-inducible. Gene set enrichment analysis of genes induced in erythroblasts versus progenitors (Alvarez-Dominguez et al., 2014) in Bloodlinc-depleted versus Bloodlinc-overexpressing cells. NES, normalized enrichment score.
(D and E) qPCR detection of erythroid markers reciprocally regulated in Bloodlinc-depleted (D) versus Bloodlinc-overexpressing (E) cells. Data are mean ± SEM from n = 2 experiments with n = 3 replicate measurements each. *p < 0.05 relative to control, t test.
See also Figure S5 and Table S2.

