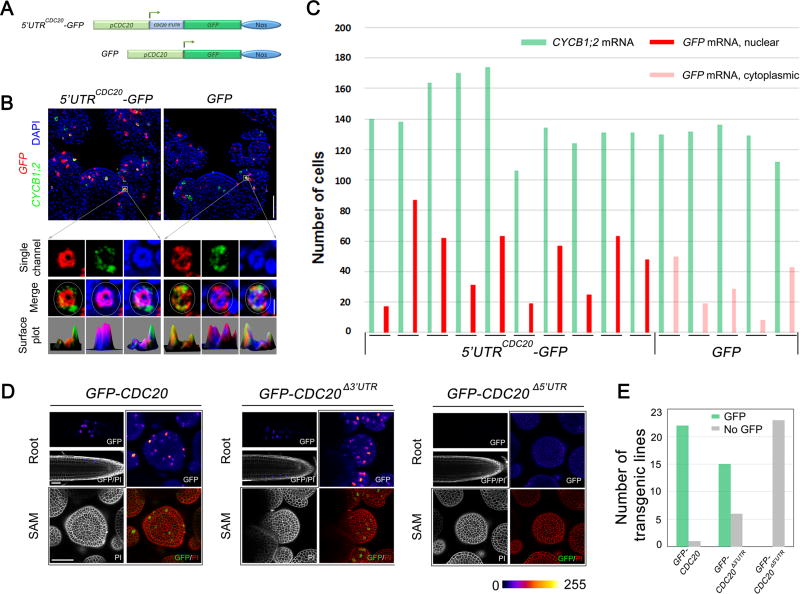
Figure 6. Dual Roles of 5’UTR in CDC20 mRNA Nuclear Localization and Translation.
(A) Schematic diagram of chimeric mRNA construction in which GFP was fused with CDC20 5’UTR. GFP alone was used a control.
(B) Localization of 5’UTRCDC20-GFP and GFP mRNAs in prophase cells. Scale bars, 50 µm for SAM overview (top panels) and 5 µm for single cells (bottom panels).
(C) Quantification of the number of prophase cells expressing5’UTRCDC20-GFP and GFP mRNAs. Each pair of columns represents cell numbers from one meristem.
(D) The expression of GFP-CDC20 fusion protein in root and SAM as revealed. No GFP fluorescence could be observed in 5’UTR truncated GFP-CDC20 transgenic plants. Scale bar, 50 µm.
(E) The number of transgenic lines analysed. GFP-CDC20 expression was detected in 22/23 lines of full length GFP-CDC20 plants, 15/21 lines of 3’UTR truncated GFP-CDC20 transgenic plants, and 0/23 of 5’UTR truncated GFP-CDC20 transgenic plants.
See also Figure S5.

