
Fig. 4.1. Simulated therapy.
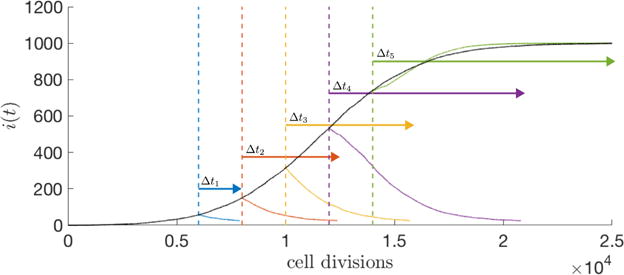
An average of 25 stochastic simulations (N = 103 cells, w = 0.5, m = 0.1) where therapy (wH = 1, wC = 0) is administered at different time points (t = 6000, 8000, 10000, 12000, 14000 cell divisions) until all cancer cells are eliminated below a small threshold value (25 cells). Time required (Δt) for tumor elimination increases as the tumor volume increases (i.e. Δt1 < Δt2 < Δt3 < Δt4, blue, red, yellow, purple arrows respectively), until, at later simulation time points, therapy is unable to regress tumor size (Δt5, green arrow).