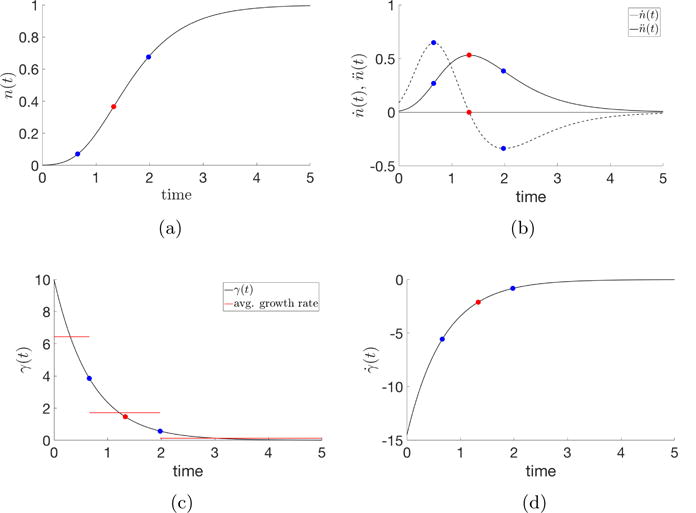
Fig. 3.1. Gompertzian equation.

Numerical simulation of the Gompertzian equation (3.1), (3.2) with parameters N0 = 0.001, γ0 = 10, and α = 0.2895. The three regimes of tumor growth are demarcated by the blue dots in each subfigure, representing the maximum and minimum of the second-derivative. (a) Cancer cell proportion, n(t), over time; (b) First- and second-derivatives of the tumor growth curve; (c) Growth rate, γ(t), over time, with the average growth rate in regimes 1, 2, 3 plotted in red; (d) First derivative of growth rate.
