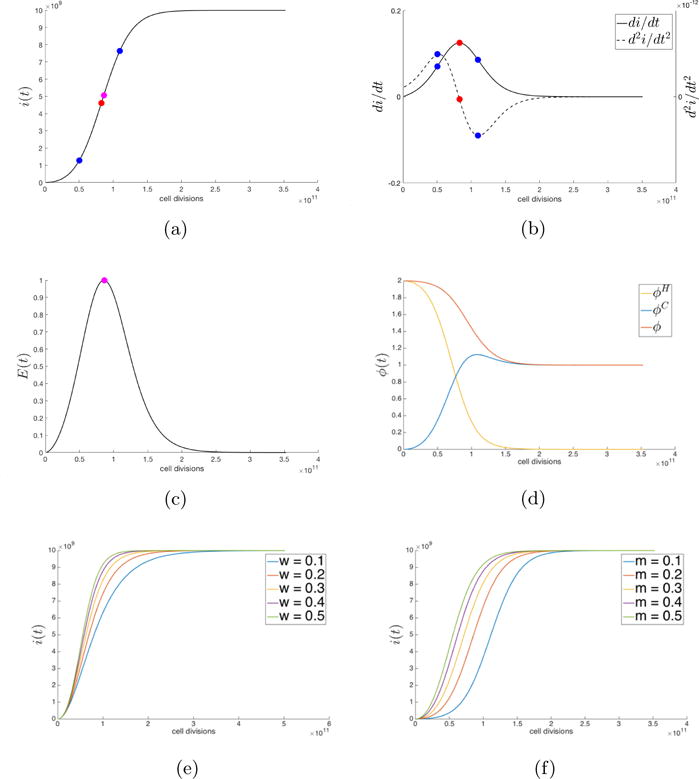
Fig. 3.2. Moran birth-death process with selection.

(a) Cancer cell population, i(t) (w = 0.5, m = 0.2, N = 1010) plotted with a spline curve connecting 200 data points from a single stochastic simulation; (b) First- and second-derivatives of the tumor growth curve in (a) are plotted with maximum and minimum of second-derivative indicated (blue); (c) Entropy of the cell population from eqn. (3.13) as it relates to the growth equation (3.14); (d) Fitness of healthy cell population and cancer cell population and total fitness as defined by eqns. (2.8), (2.9), (2.10); (e) Simulations of cancer cell population, i(t), for a range of selection parameter values; (f) Simulations of cancer cell population, i(t), for a range of mutation rate values.
