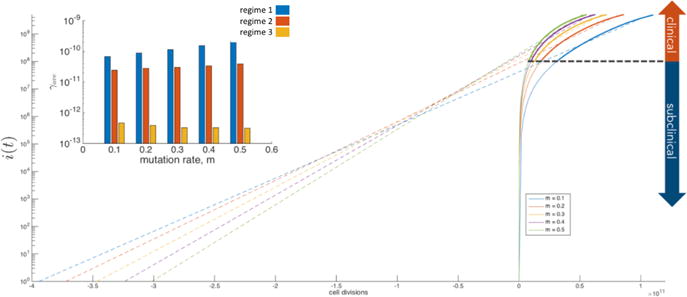
Fig. 3.3. Tumor initiation prediction.

Five sample stochastic simulations of tumor growth (N = 1010 cells, w = 0.5, m = 0.1, 0.2, 0.3, 0.4, 0.5) plotted on a log-linear graph where the model output (i(t), solid lines) is fit in the clinical regime (greater than 108 cells) using an exponential growth equation and extrapolated backwards in simulation time (dashed lines). The inset bar graph shows the average growth rate in each regime.
