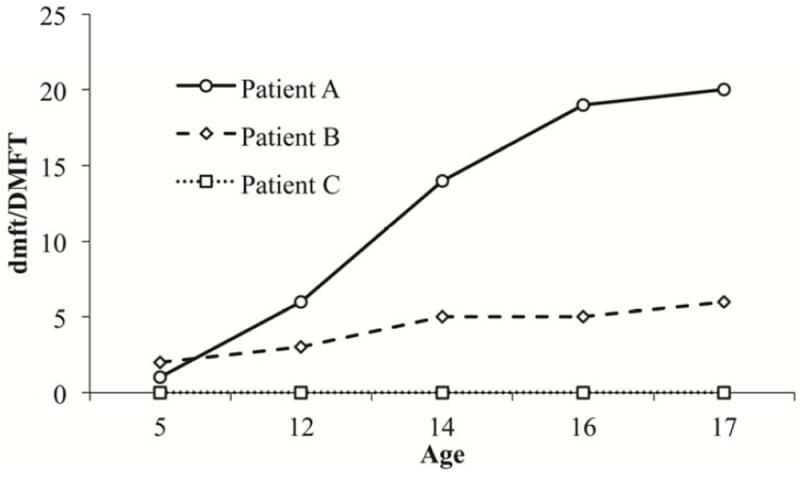
Appendix Figure 1. Graphical representation of selected Table 1 and 2 patients’ longitudinal DMFT data.

Patient A shows spikes of four or more between ages 5 and 12, 12 and 14, and between 14 and 16. Patient B fits into the high caries experience group and the very high caries experience group, but has no spike in disease experience between time points. Patient C has no caries experience.
