
Figure 5. GSLs Induce Toxicity through α-Syn.
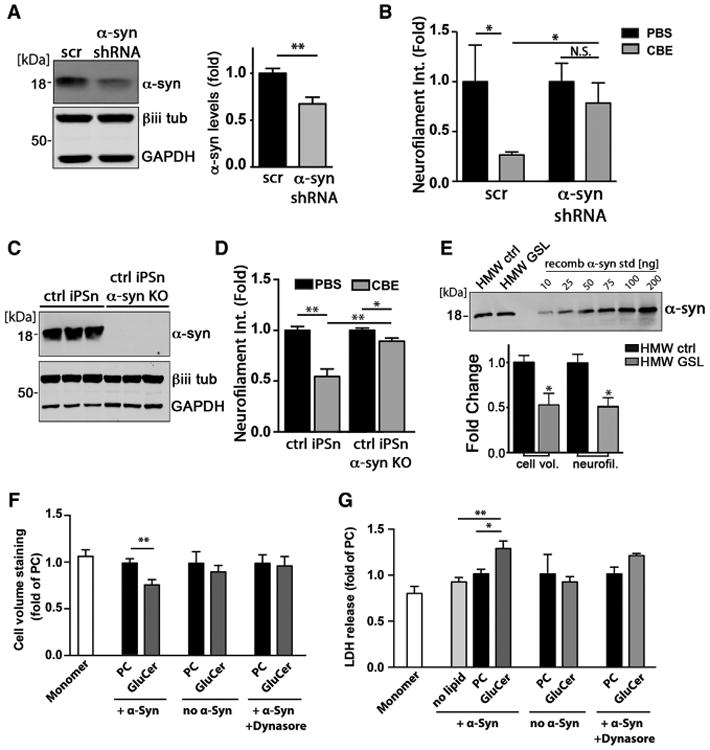
(A) iPSns were infected with lentiviral particles that express either scrambled (scr) or shRNA to knock down α-Syn (7 days, MOI = 5). Western blot shows knockdown efficiency. β-iii-tubulin and GAPDH were used as loading controls. Quantification is shown to the right (n = 3).
(B) Neuron viability was determined by neurofilament quantification in iPSns treated with PBS or CBE (n = 4).
(C) Western blot of α-Syn demonstrating an efficient KO in three replicates. β-iii-tubulin (βiii tub) and GAPDH were used as loading controls.
(D) Neuron viability was determined as in (B) from ctrl of α-Syn KO iPSns treated with 50 μM CBE for 7 days (n = 4).
(E) HMW-ctrl or HMW-GSL was isolated and quantified against recombinant α-Syn standards. Equal amounts were applied into the culture media of control iPSns and neurotoxicity was determined by neurofilament and cell volume quantification (n = 4).
(F) Recombinant α-Syn was incubated with GluCer to generate HMW-GSL species in vitro, then applied to H4 cultures. Cultures were treated with α-Syn monomers alone, α-Syn + PC, or PC/GluCer lipids without α-Syn as controls, and viability was assessed as in (E). Dynasore, endocytosis inhibitor.
(G) H4 cells were incubated using the same conditions described in (F), and cellular toxicity was assessed through release of lactate dehydrogenase (LDH) into the culture media (n = 4). Values are expressed as fold change compared to PC + α-Syn for (F) and (G). For all quantifications, values are the mean ± SEM (*p < 0.05, **p < 0.01).