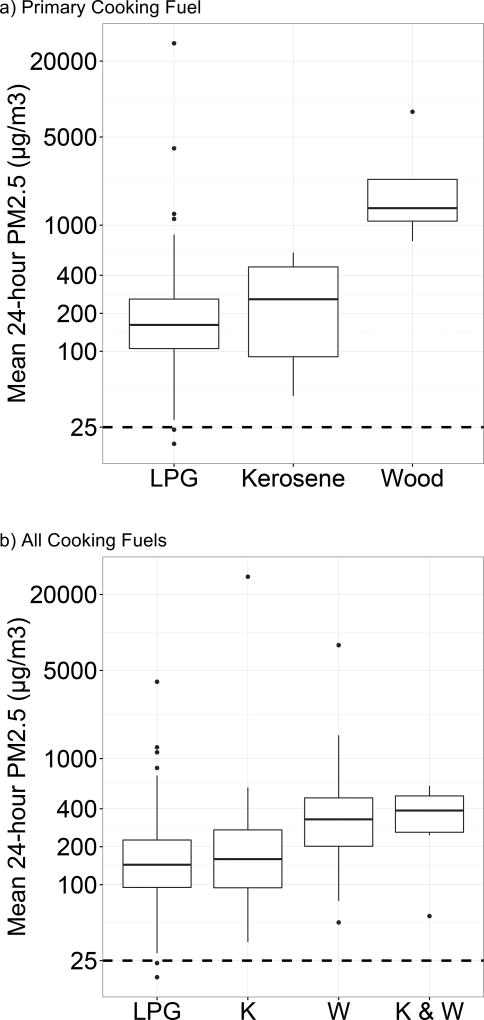
Figure 1.
Distribution of the mean 24-hour time-weighted-average PM2.5 concentration (µg/m3) as compared to the WHO 24-hour standard of 25 µg/m3 (dashed line) by type of a) primary cooking fuel and b) all cooking fuels in low-income urban homes in Pune, India (n = 166).
K: Kerosene but no wood; W: Wood but no kerose;
K & W: Both kerosene and wood

