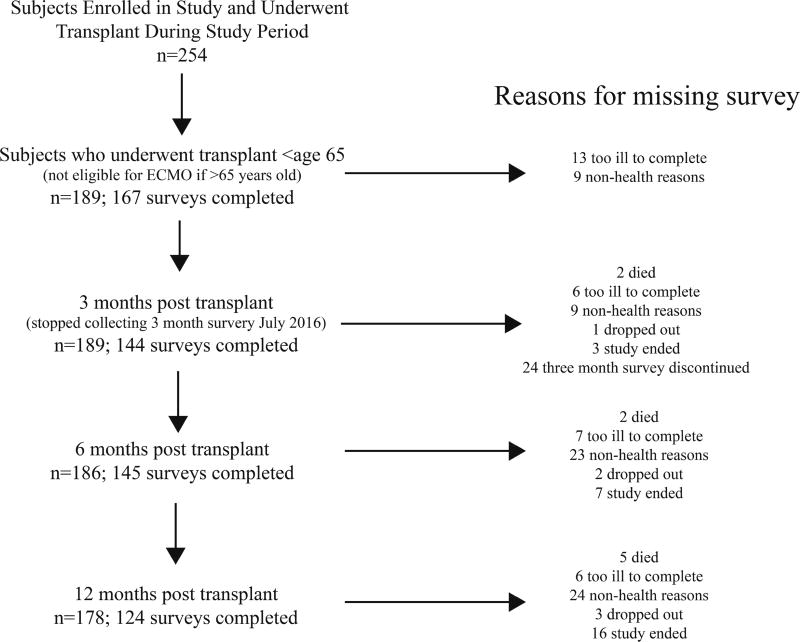
Figure 1. Flow chart of subjects throughout the study.
Left-sided column represents number of subjects providing data for analysis at each time point. The number of subjects at the three-month post-transplant time point was less than six month time point because we stopped administering surveys at 3 months post-transplant after July 2016. Right-sided column explains reasons for missing surveys at each time point.

