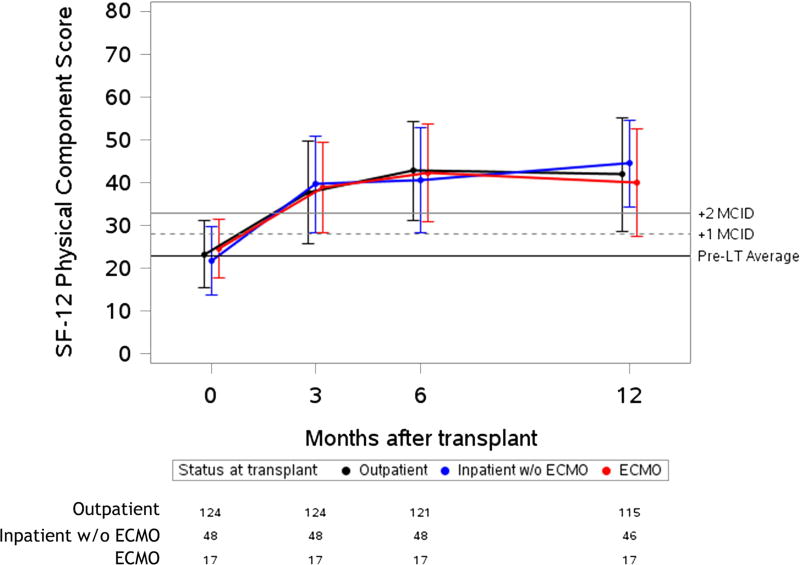
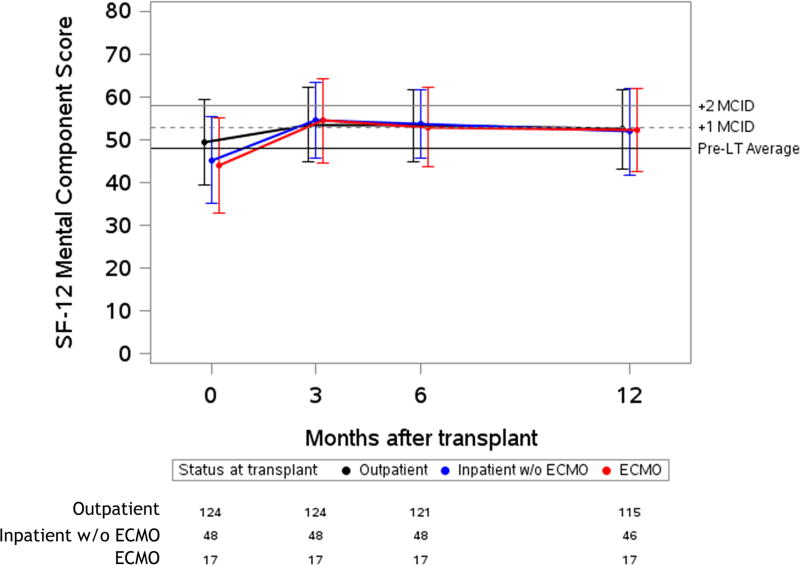
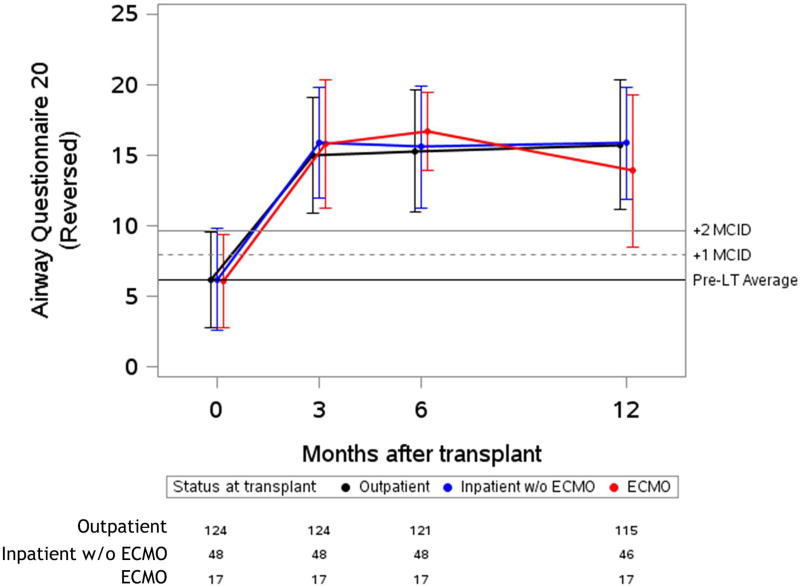
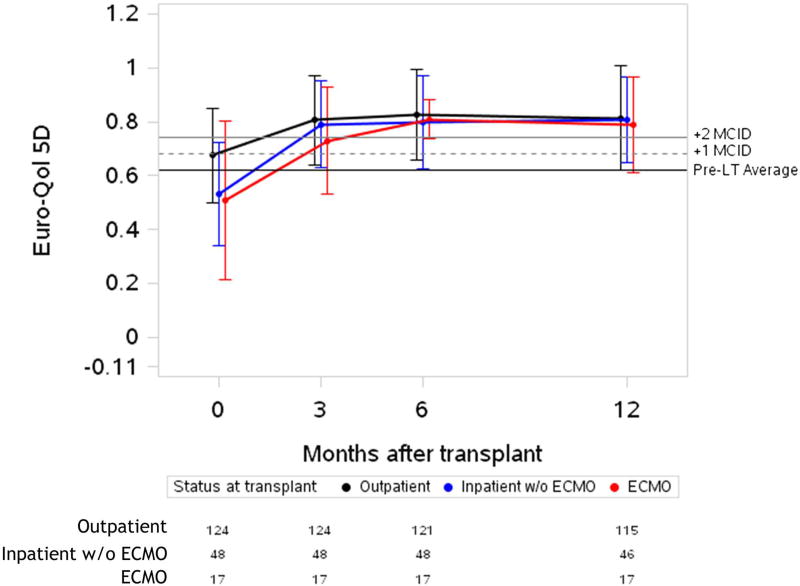
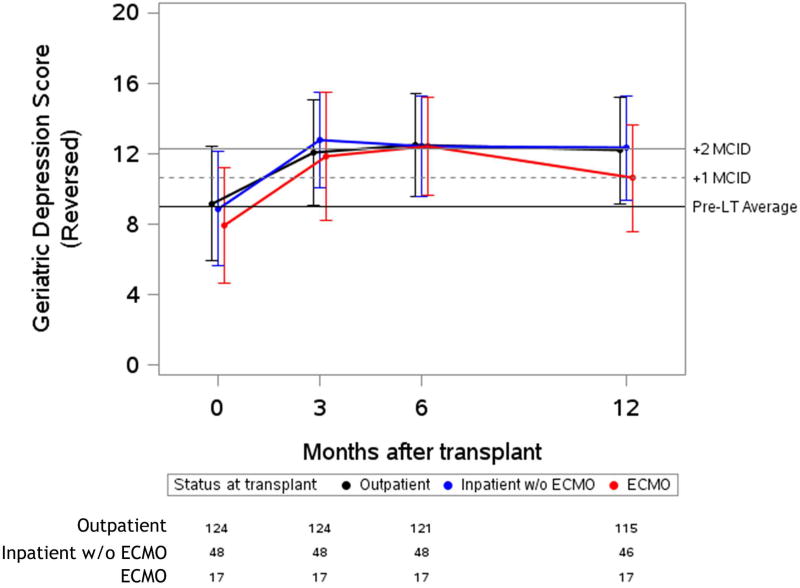
Figure 2. Unadjusted plots of average health-related quality of life from before to one-year after lung transplantation.
Unadjusted plots of average health-related quality of life (HRQL) from before to one-year after lung transplantation. (a) SF-12PCS (Generic-Physical HRQL); (b) SF-12MCS (Generic-Mental HRQL) (c); AQ20R (Respiratory Specific HRQL) (d); EQ5D (Health Utility HRQL); (e) GDS (Depression Scale). Red lines represent subjects who required ECMO as a bridge to transplant, blue lines represent subjects who were hospitalized but not on ECMO at the time of transplant and black lines represent subjects called in for transplant from the outpatient setting. Whiskers represent one standard deviation above and below the mean HRQL values for each time point. On the Y axis, the first horizontal black line denotes pre-transplant mean scores; the dashed and solid horizontal lines above denote a change in score equal to one- and two-times the minimally clinically important difference (MCID), respectively.

