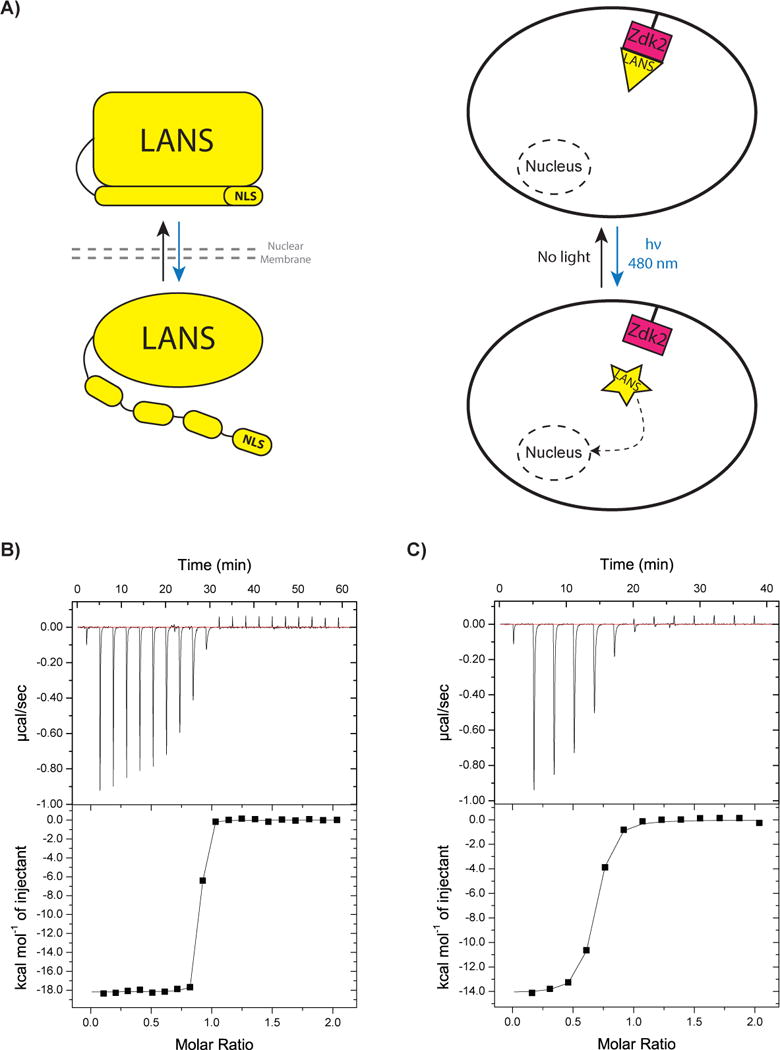
Figure 1.

LANSTRAP system schematic and in vitro characterization. A) A schematic of LANS alone (on the left) and LANSTRAP (on the right) where LANS binds Zdk2 from LOVTRAP in the dark and sequesters it in the cytoplasm (above) until blue light illumination triggers its dissociation and translocation to the nucleus (below). The blue arrow indicates light illumination and activation and the black arrow its reversion when the stimulus is absent in the dark. B) ITC binding measurement for LANS wild-type with Zdk2 and C) LANS lit mimic (I539E) to Zdk2.
