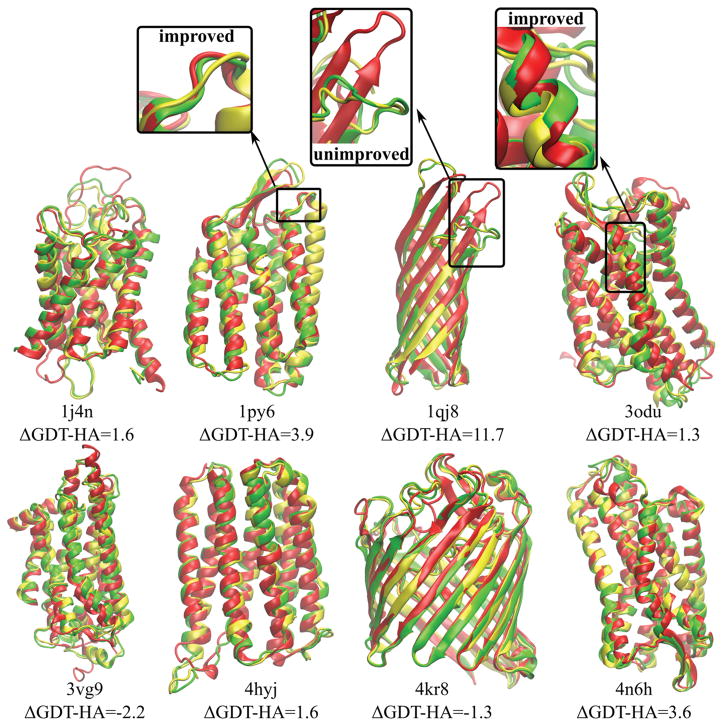
Figure 1.
Native structures of target proteins (red) vs. homology models (yellow) and refined models (green) using the RWplus scoring function for filtering. ΔGDT-HA values indicate the change after refinement from the initial homology models with respect to the native structures. Six proteins out of eight give positive ΔGDT-HA indicating an improvement in the secondary structures. Examples of improved and unimproved structural parts inside the boxes are shown in more detail.

