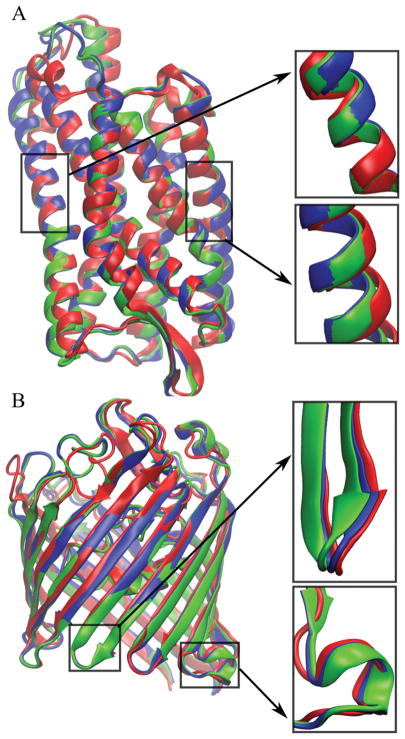
Figure 2.
Structures of target proteins (red), final models from the DPPC bilayer simulations (green), final models from the water simulations (blue) after the refinement using the RWplus scoring function for 4n6h (A) and 4kr8 (B). Details of the differences selected structure parts in the membrane and water regions are shown in the boxes.

