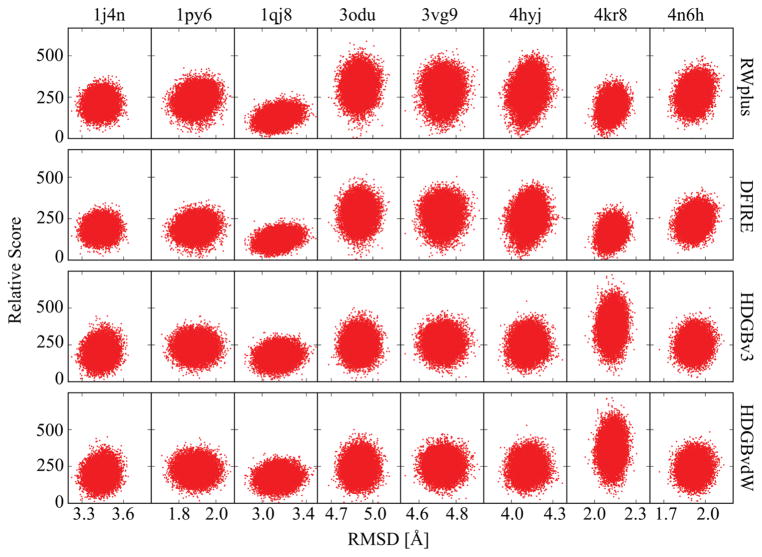
Figure 3.
Score values vs. Cα RMSD from the native structure for each target with different scoring functions for snapshots extracted from the MD simulations with DPPC lipid bilayers. scattering plots. Scores are given relative to the respective minimum energy values. Energy values for the HDGB-based scores are given in units of kcal/mol.

