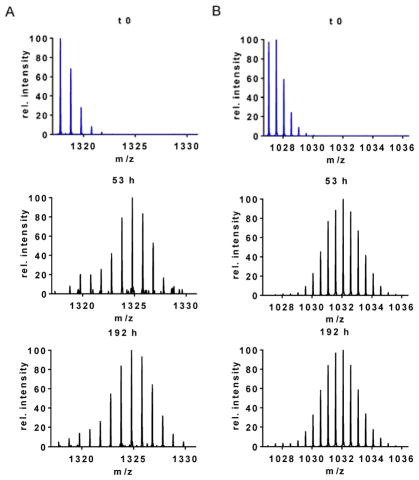
Figure 2.
Mass spectra of peptide 5–17 (+1; MKGLSKAKEGVVA) indicating mass shifts at various time points of the aggregation reaction as compared to an undeuterated control at the top left (blue spectrum). The isotopic envelopes exist as binomial distributions with a very small, protected second component ≥ 53 h. B. Mass spectra of peptide 95–113 (+2; VKKDQLGKNEEGAPQEGIL) at various time points of the aggregation as compared to the undeuterated control at the top left (blue spectra). The isotopic envelopes remain predominantly unimodal.

