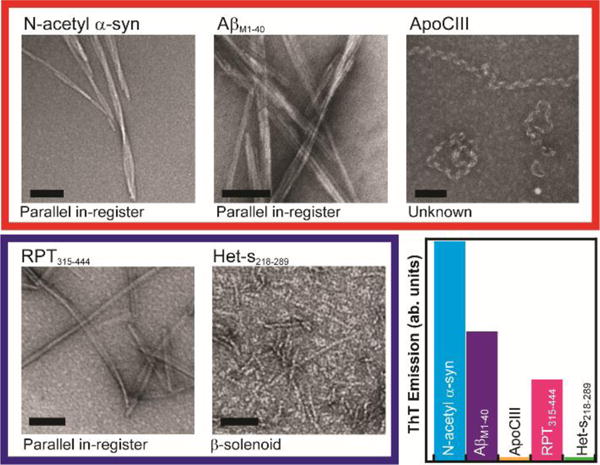
Figure 1. Summary of amyloids.

Representative negatively-stained TEM images of pathological (top row, outlined in red) and functional (bottom row, outlined in blue) amyloids. Current amyloid structure based on literature as indicated.4, 10, 12, 13 Scale bars: 100 nm. ThT emission assay (integrated intensity from 450 nm to 550 nm) comparing amyloids ([final protein] = 5 μM, [ThT] = 10 μM).
