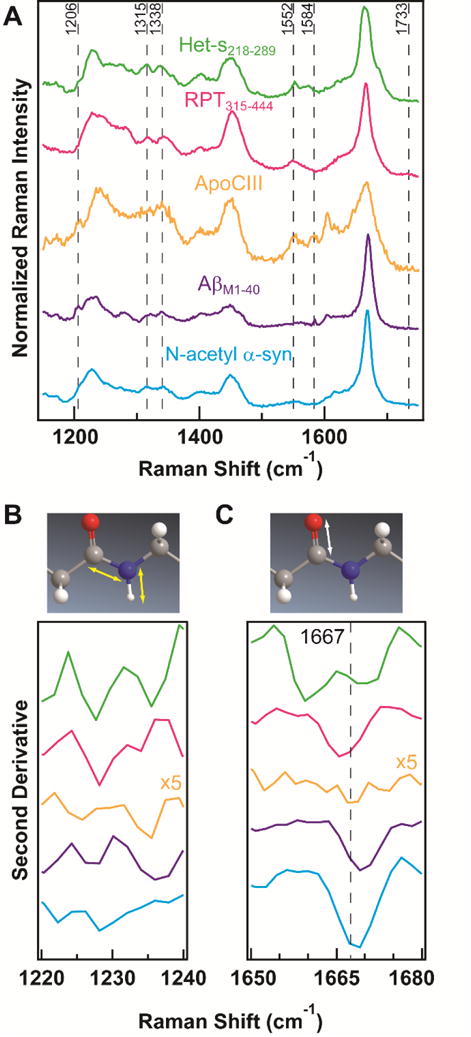
Figure 2. Raman spectra of amyloids.

(A) Fingerprint region of Raman spectra. Spectra were collected at RT and have been normalized to the respective amide-I band maximum. Second-derivative analysis of (B) amide-III and (C) amide-I regions, with respective molecular vibrations of the peptide backbone shown above. Spectra are color-coded as in (A). ApoCIII second derivative intensities have been multiplied by 5 for clarity. Dashed line in (C) indicates reported literature value for β-sheet conformation.17
