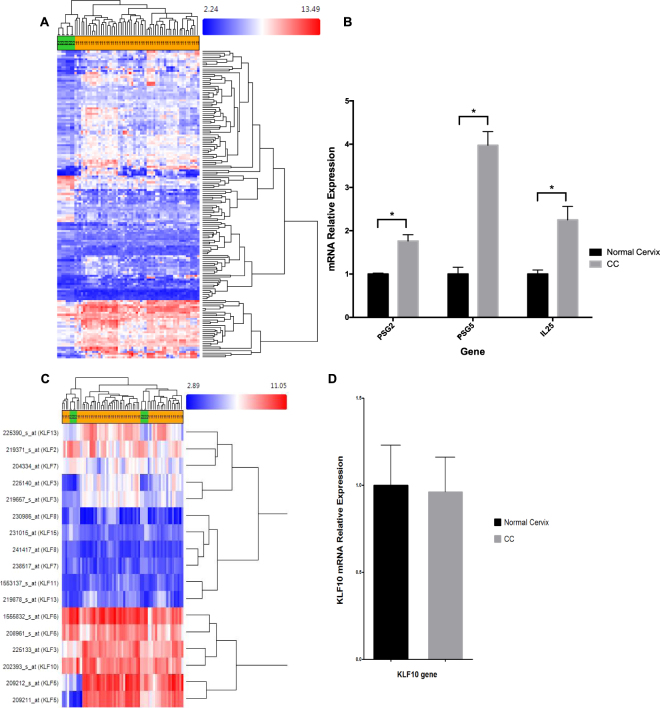
Figure 2.
Transcriptome analysis of cervical tissue. (A) Heat map indicating differentially expressed immune related genes between normal and CC samples as detected by in silico analysis of the array datasets. (B) RT-qPCR validation of PSG2, PSG5 and IL25 in cervical cancer samples collected by our laboratory. Black bars represent basal expression in normal cervical tissue while grey bars represent expression in cervical cancer. (C) Hierarchical clustering indicating the expression levels of KLF family members in normal tissue and CC. (D) RT-qPCR analysis demonstrating no significant differences in the expression levels of KLF10 between normal (black bar) and CC (grey bar) tissue.

