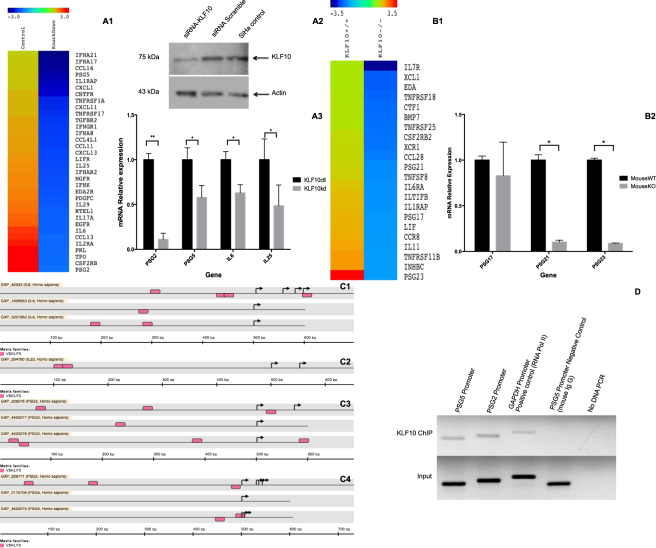
Figure 3.
Relative expression analyses of IL25, PSG2 and PSG5 genes. Panel (A1) Heatmap depicting expression levels of indicated immune system response genes that are down regulated in SiHa cells following siRNA-mediated suppression of KLF10. Panel (A2) Western blot depicting KLF10 protein levels in the knocked down cells compared to scrambled siRNA and untreated control cells. Panel (A3) show RT-qPCR validation of the down-regulated genes in microarray data: IL6 with 38%, IL25 with 52% PSG5 with 43% and PSG2 with 89% down regulation in KLF10 siRNA treated cells in comparison with the control cells without any treatment. Panel (B1) presents heatmap corresponding to immune system response related genes dowregulated in KLF10 KO mouse compared to KLF10 WT mouse. Panel (B2) show RT-qPCR validation of PSG17 down regulation of 18%, PSG21 90% and PSG23 92% down-regulation in KO mouse cervical tissue compared to WT mouse tissue. Black bars represent the control cells (KLF10ct) or the WT mouse (KLF10wt), while grey bars represent the KLF10 knock down cells (KLF10kd) and knock out mouse (KLF10ko) in each panel respectively. Panel (C1–C4) shows the in silico results for the analysis of promoter regions from IL6, IL25, PSG2 and PSG5 genes respectively, MatInspector module from Genomatix Software was used. Pink rectangles represent the putative region were KLF10 responsive sequence could be located. Panel (D) show the KLF10-immunoprecipitated DNA. The first two lanes present PSG promoter region associated to KLF10. Whereas lanes three and four present GAPDH promoter in RNA Pol II immunoprecipitated DNA as positive control, and PSG5 promoter in mouse-IgG immunoprecipitated DNA as negative control. All ChIP lanes present Input DNA control. Agarose gel was cropped; all reactions were electrophoresed in the same gel.

