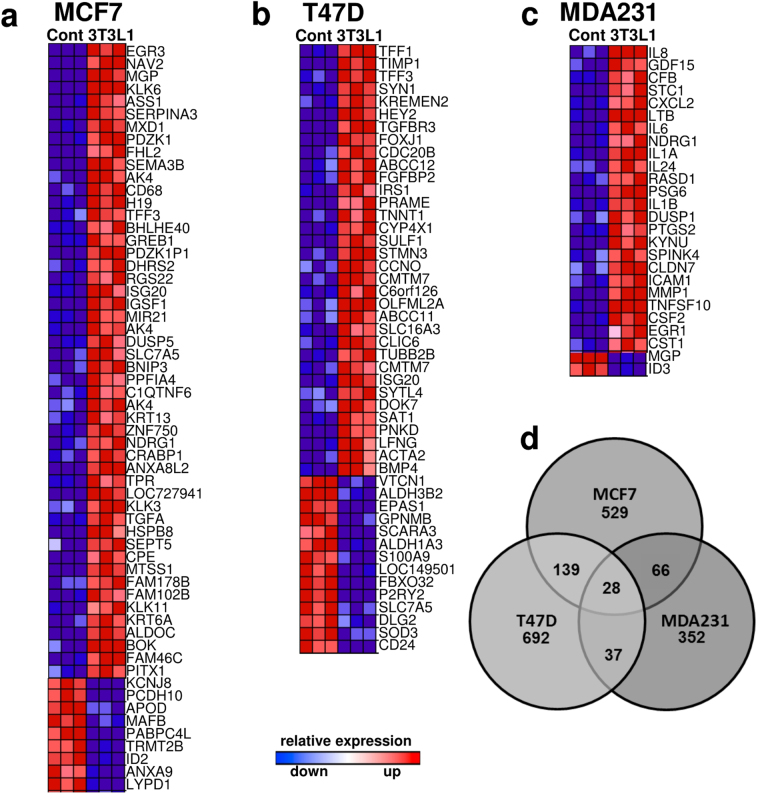
Figure 1.
Distinct gene expression profiles in breast-cancer cell lines co-cultured with 3T3-L1 adipocytes. Rank-based heatmaps displaying the top up- and down-regulated genes (≥2.0-fold) in the breast cancer cell lines (a) MCF7, (b) T47D and (c) MDA-MB-231 co-cultured with 3T3-L1 adipocytes. Red indicates up-regulation in co-culture; blue indicates down-regulation; see Supplemental Tables S2–S4 for absolute fold-changes. (d) Venn-Diagram representation of significantly differentially expressed genes (≥1.3-fold expression differences) in the respective cell lines.

