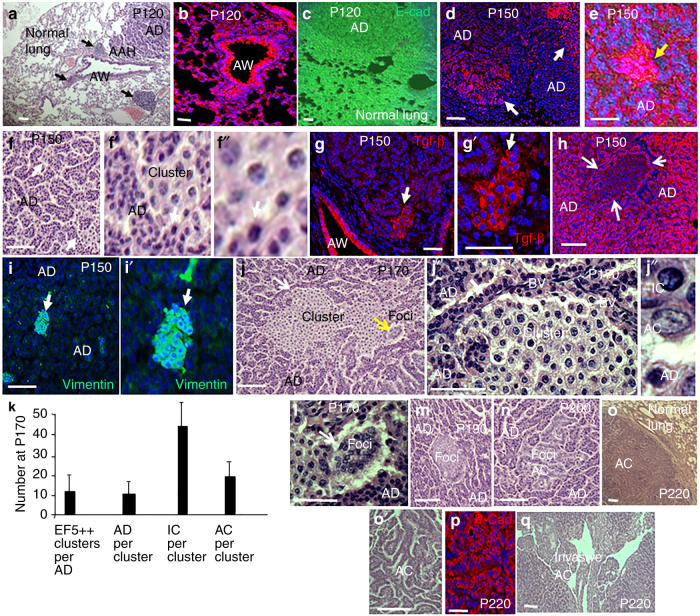
Fig. 1.
Inflammation, Tgf-β1 accumulation, hypoxia, and EMT mark cancer cell-generating clusters in expanding adenomas. a H&E staining showing sites of atypical adenomatous hyperplasia (AAH) originate around bronchial airways (AW), and then begin expanding into precancerous adenomas (AD) by P120 in K-Ras mutant mice. These sites are linked to infiltrating inflammatory cells. High concentrations of inflammatory cells are shown by black arrows, but lower levels of these infiltrating cells have spread throughout the lung. b Sites of AAH, AD, and inflammation are rich in Tgf-β1. c Normal lung, AAH. and AD express E-cadherin (E-cad). d Immunostaining for EF5 shows that by P150 the interiors of expanding AD are hypoxic (EF5+). e Highly EF5-positive sites (EF5++) are present in the hypoxic interiors of expanding AD. f–f″ EF5++ sites represent small clusters of cells with decondensed chromatin. Arrows in panel f show two such clusters surrounded by AD cells, which contain small nuclei with dense heterochromatin. Arrows in panels f′ and f″ show the same location. g, g′ EF5++ clusters are sites of Tgf-β accumulation. Arrows show the same position in panels g and g′. h Consistent with EMT, loss of E-cad marks cell clusters. Arrows show the outline of the cluster. i, i′ The mesenchymal marker Vimentin is induced in cell clusters. Arrows show the same position in panels i and i′. j–j″ By P170, clusters have expanded. The yellow arrow in panel j shows cancer cells forming dense foci (see panel k). The white arrows in panels j and j′ show the same position. “BV” are blood vessels within AD at the AD/cluster border. Note absence of BV within the cluster. Panel j″ shows an AD cell with a small heterochromatin dense nucleus, a euchromatic AC cell containing a larger euchromatic vesicular nucleus with an irregular contour and nucleolar enlargement, and a cell with an intermediate nuclear morphology evidenced by heterochromatin decondensation. These cells displaying an intermediate nuclear morphology are termed intermediate cells (IC). k Hypoxic EF5++ clusters, first identified in panel e, were counted per adenoma, and cell types were counted within clusters at P170 in four lungs (20 adenomas). l–n AC cells assemble into dense foci and form papillary structures. The yellow arrow in panel l shows the same position in panel j. o, o′ By P220, AC cells had formed large tumors. p As opposed to IC, but similar to adenoma cells, the tumors cells expressed E-cad and thus did not show evidence of EMT. q Invasion of expanding tumors into airways is shown. n > 5 for each age. Bars are 50 μm

