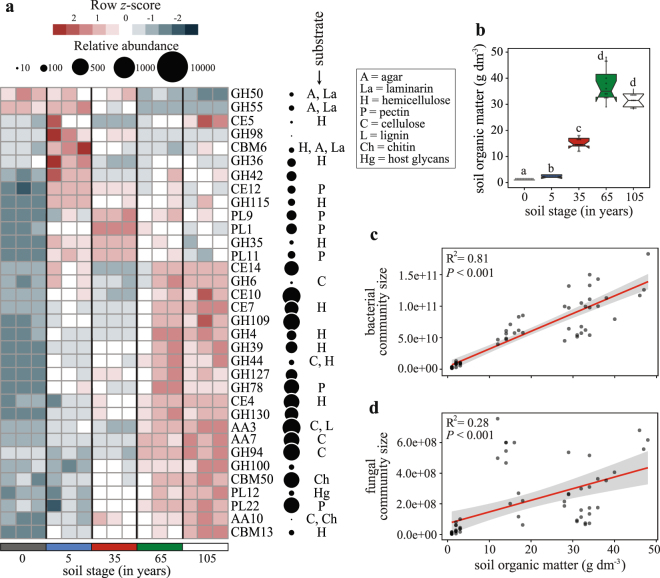
Figure 3.
Soil organic matter (SOM) drives the size of the microbiomes and the distribution of CAZy families through soil formation. (a) Heatmap displays the relative abundance (row z-scores) of CAZy gene families that segregated statistically differently across the soil stages, identified by random forest analysis with Boruta feature selection (average z-scores of 1000 runs >4) (Supplementary Table S5). Circles are proportional to the relative abundance of each gene family in all samples. (b) Notched box plot depicts the increments in SOM across the soil stages. Different letters indicate significant differences (independent Mann-Whitney U test results performed only for pairwise comparisons between consecutive soil stages, P < 0.001). (c) Bacterial and (d) fungal community sizes (log copy numbers of the maker gene per gram of soil) increments through soil formation. Data are shown as a function of the progressive increments in SOM. The solid lines are linear regression models (contour lines are 95% confidence intervals), and statistics are provided on the panels.

