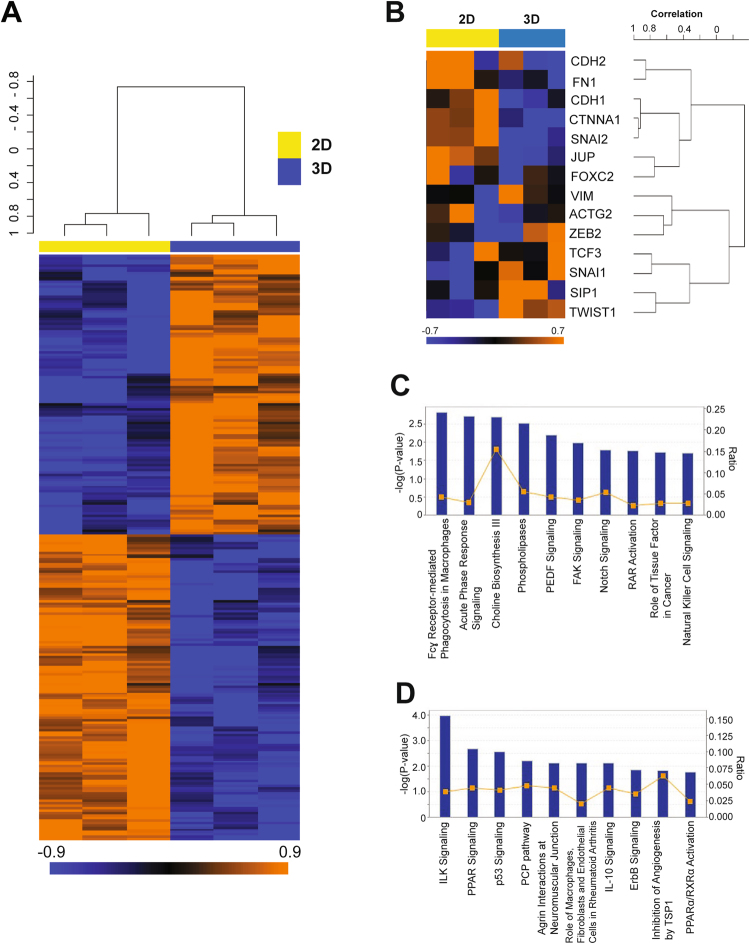
Figure 2.
Differentially expressed genes in Matrigel-cultured SUM149 cells represent EMT and inflammatory response pathways. (A) Heatmap of transcripts from monolayer- and Matrigel-cultured SUM149 cells (a triplicate sample from each) showing the 152 differentially expressed probe sets between these two conditions. Orange and blue indicate higher and lower relative expression, respectively. (B) Heatmap of EMT-related transcripts from monolayer- and Matrigel-cultured SUM149 cells (a triplicate sample from each). (C,D) Canonical pathway analyses by Ingenuity pathway analysis (IPA) software of overexpressed (C) and underexpressed (D) genes in Matrigel-cultured SUM149 cells compared to monolayer-cultured SUM149 cells. Annotated pathways were ranked according to the values of −log (P-value).

