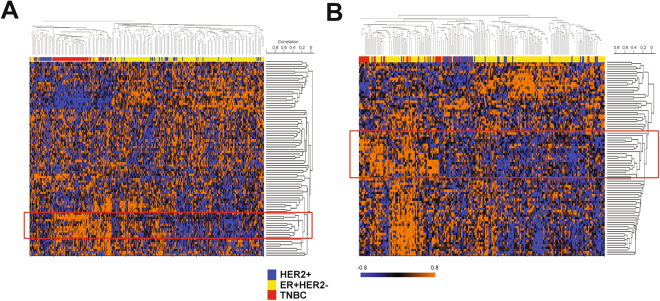
Figure 3.
Gene signature derived from Matrigel-cultured SUM149 cells represents activated inflammatory response genes in human TNBC. (A,B) Heatmaps of Wang (A) and MDA233 (B) breast cancer data sets with overexpressed genes in Matrigel-cultured SUM149 cells. Unsupervised hierarchical clustering was applied to draw these heatmaps. Before the clustering, patients in each data set were categorized into 3 subgroups: ER+ HER2−, HER2+, and TNBC, according to the transcriptional levels of ESR1 and ERBB2 (or HER2) as previously described40. Red boxes denote gene clusters that were highly correlated with TNBC sample clusters. Orange and blue indicate higher and lower relative expression, respectively.

