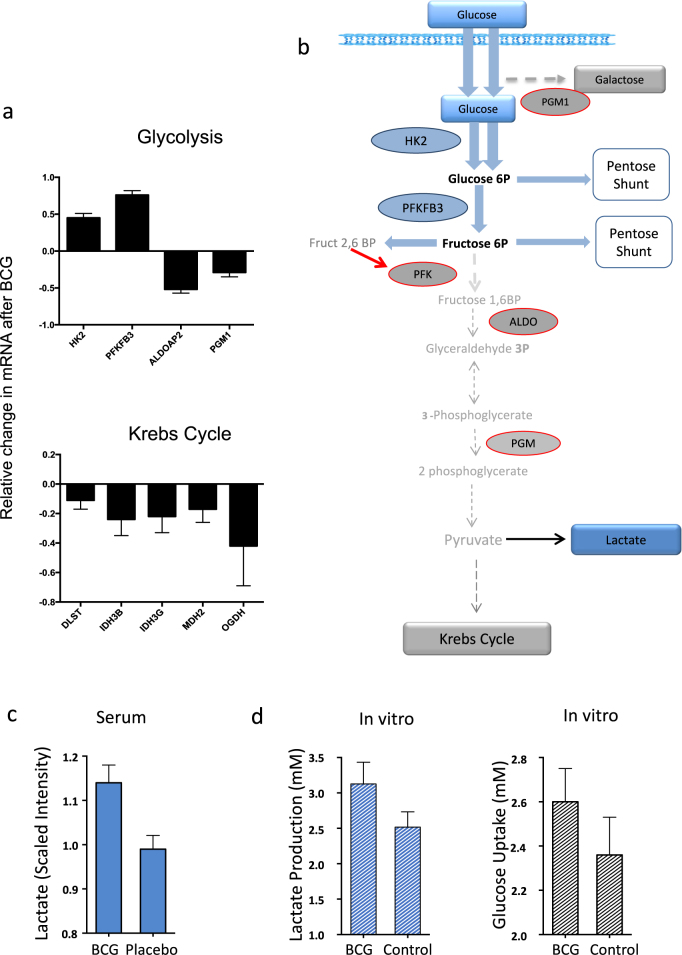
Fig. 4.
Analysis of mRNA expression and of Metabolites corroborates with the switch from the Krebs Cycle to augmented early aerobic glycolysis after BCG. a mRNA expression analysis of type 1 diabetic PBLs before and after BCG treatment in vitro. BCG causes upregulation of mRNA for early glycolysis (HK2, PFKB3), downregulation for late glycolysis (ALDOAP2, PGM1), and a strong downregulation of mRNA for late Krebs cycle steps (bottom). p and q values for the genes shown are HK2 (p = 0.049, q = 0.017), PFKB3 (p = 0.016, q = 0.017), ALDOAP2 (p = 0.113, q = 0.017), PGM1 (p = 0.022, q = 0.017), DLST (p = 0.074, q = 0.017), IDH3B (p = 0.084, q = 0.017), IDH3G (p = 0.084, q = 0.017), MDH2 (p = 0.090, q = 0.017) and OGDH (p = 0.070, q = 0.017). Combined p values for the Krebs cycle genes using Fisher’s method is 0.005. b The schematic summarizes the normal pathway for glucose oxidation via the Krebs cycle and the connecting nodes to the Pentose Phosphate Shunt. Blue rectangles and blue ovals represent upregulated metabolites and mRNA, respectively, after BCG. Gray rectangles and gray ovals represent downregulated metabolites and mRNA, respectively, after BCG. Three BCG-treated T1D subjects were studied. Bars on Fig. 4a, c, d depict SD. The blue shading in Fig. 4b represents the upregulated mRNAs (ovals) and metabolites (rectangles). c Serum lactate levels in Phase 1 BCG-treated vs. placebo patients as determined by Metabolon’s GC/HPLC and MassSpec platform one year after treatment. Lactate levels were significantly higher in the BCG-treated patients than placebo-treated patients (p = 0.001 and q = 0.003) (data from subjects represented in Supplementary Table S1e). d Cultured CD4 cells from T1D subjects in the presence or absence of BCG for 48 h (n = 25 paired samples) showed both augmented lactate production and accelerated glucose uptake. A short 4-hour collection time of media from either glucose uptake or for lactate secretion after 48 h of BCG or media exposures (control) showed significantly more lactate production after BCG exposures (p = 0.025, n = 25) and accelerated glucose consumption (p = 0.02, n = 27) as compared to control lymphocytes that were cultured without BCG

