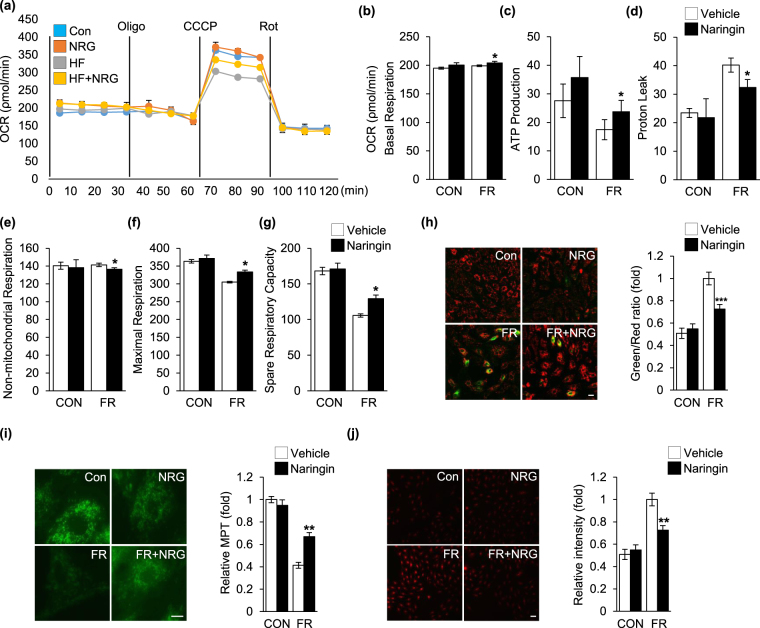
Figure 2.
Regulation of mitochondrial function by naringin in fructose-exposed cardiomyocytes. (a) The mitochondrial oxygen consumption rate (OCR) was analyzed to assess the mitochondrial profile. Graphs show the quantification of the mitochondrial basal respiration rate (b), ATP production (c), proton leak (d), non-mitochondrial respiration (e), maximal respiration rate (f), and spare respiratory capacity (g). (h) Mitochondrial membrane potential (MP) in H9c2 cells was evaluated by JC-1 fluorescence level. The histogram represents the quantification of MP as a ratio of JC-1 (green/red) in the different treatment groups. (i) The rhodamine-123 fluorescence level for evaluation of mitochondrial membrane permeability transition (MPT). Histograms represent the quantification of fluorescence intensity. (j) The MitoSOX fluorescence level for evaluation of mitochondrial ROS generation in H9c2 cells. The histogram represents quantification of fluorescence intensity. Results are shown as the mean ± S.D. of three separate experiments (*P < 0.05, **P < 0.01, ***P < 0.001 vs. fructose treated group). Scale bar in images indicates 20 μm. Con: control group, FR: fructose group, NRG: naringin treatment group compared with vehicle group.

