Fig. 5.
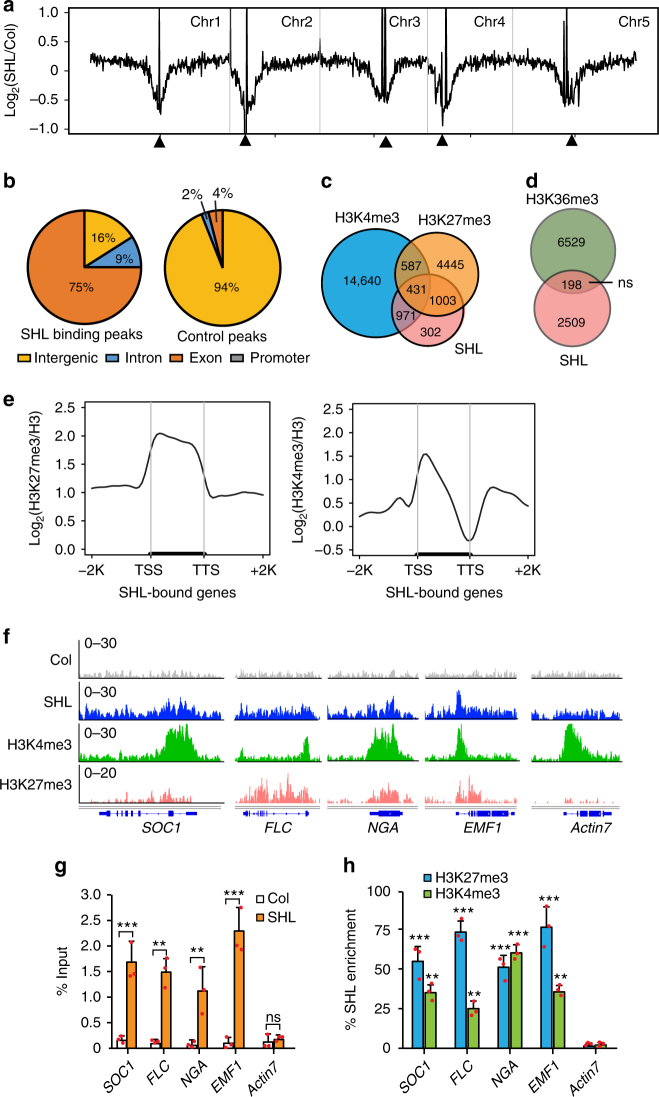
SHL co-localizes with H3K4me3 and H3K27me3 in the genome. a Chromosomal views show that SHL is highly enriched in gene-rich euchromatic regions. Y-axis represents the Log2 value of ChIP-seq reads normalized to wild-type Col. The Chr1, Chr2, Chr3, Chr4, and Chr5 represent the five Arabidopsis chromosomes. Black triangle indicates the location of the centromere. b Genomic distribution of SHL ChIP-seq peaks. Control peaks are the same numbers of regions as SHL-bound peaks randomly selected from the genome. c Venn diagram showing the overlap of SHL-, H3K4me3-, and H3K27me3-enriched genes. d Venn diagram showing the overlap of SHL-bound genes with H3K36me3-marked genes. The P value is based on the hypergeometric test. ns, not significant. e Metaplots of H3K27me3 and H3K4me3 levels over the transcription unit of SHL-bound genes. Y-axis represents the levels of histone modifications normalized with H3. TSS, transcription start site; TTS, transcription termination site; -2K, 2kb upstream of TSS; +2K, 2kb downstream of TTS. f Genome-browser view of normalized ChIP-seq peaks at representative loci. g Relative enrichment of SHL at the indicated loci in (f) calculated as the percent of input materials. h Sequential ChIP-qPCR showing the H3K4me3 and H3K27me3 enrichment relative to SHL at the indicated loci in (f). Actin7 serves as a control locus. All error bars represent mean ± SD from three independent experiments. Red dots denote the individual data points. Student’s t-test was used to calculated the P value. *P < 0.05; **P < 0.01; ***P < 0.001; ns, not significant

