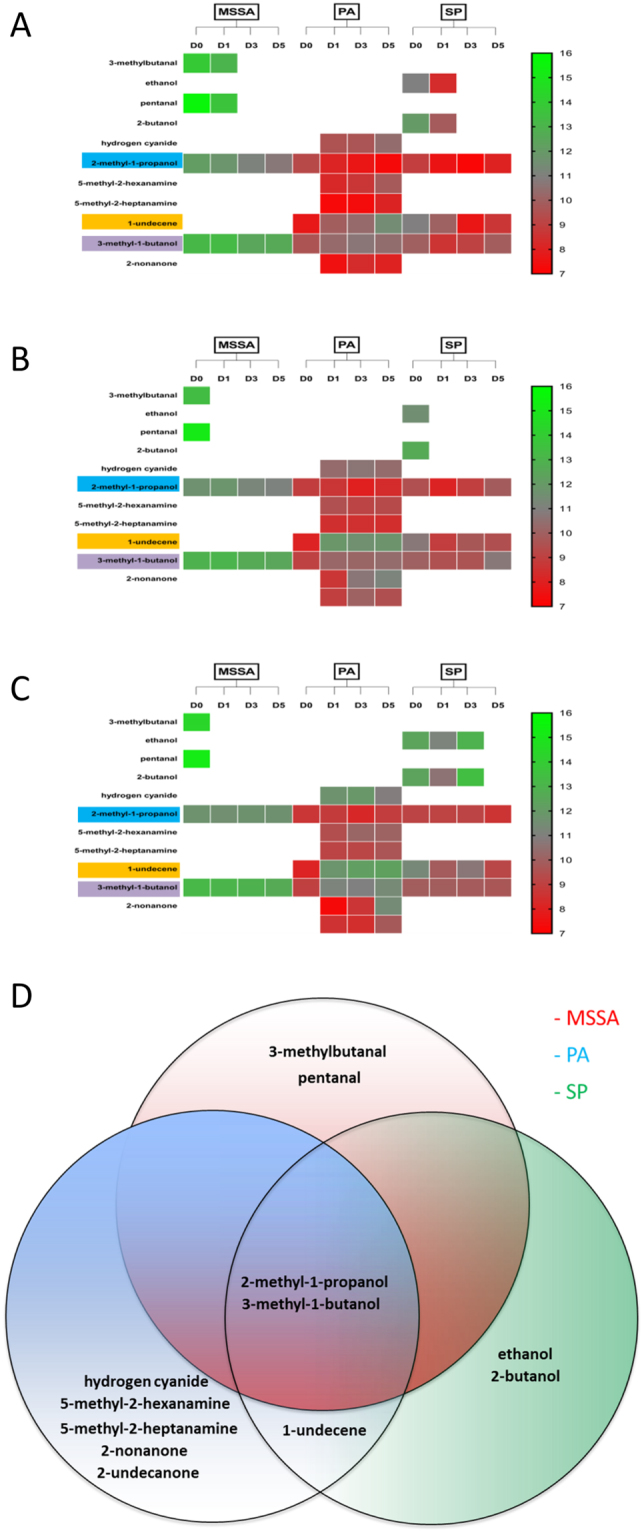
Figure 6.

Heat map and Venn diagram representing the distribution of VOCs in different wound models. Heat map outlining the presence and relative abundance (chromatographic peak area) of a VOC based on bacterial species and time points in the in vitro (A), ex vivo human cutaneous incisional (B) and excisional wound (C) models. (D) Venn diagram identifying VOCs unique to and shared between MSSA, PA and SP. MSSA, methicillin sensitive Staphylococcus aureus ATCC 29213; PA, Pseudomonas aeruginosa; SP, Streptococcus pyogenes; VOCs, volatile organic compounds.
