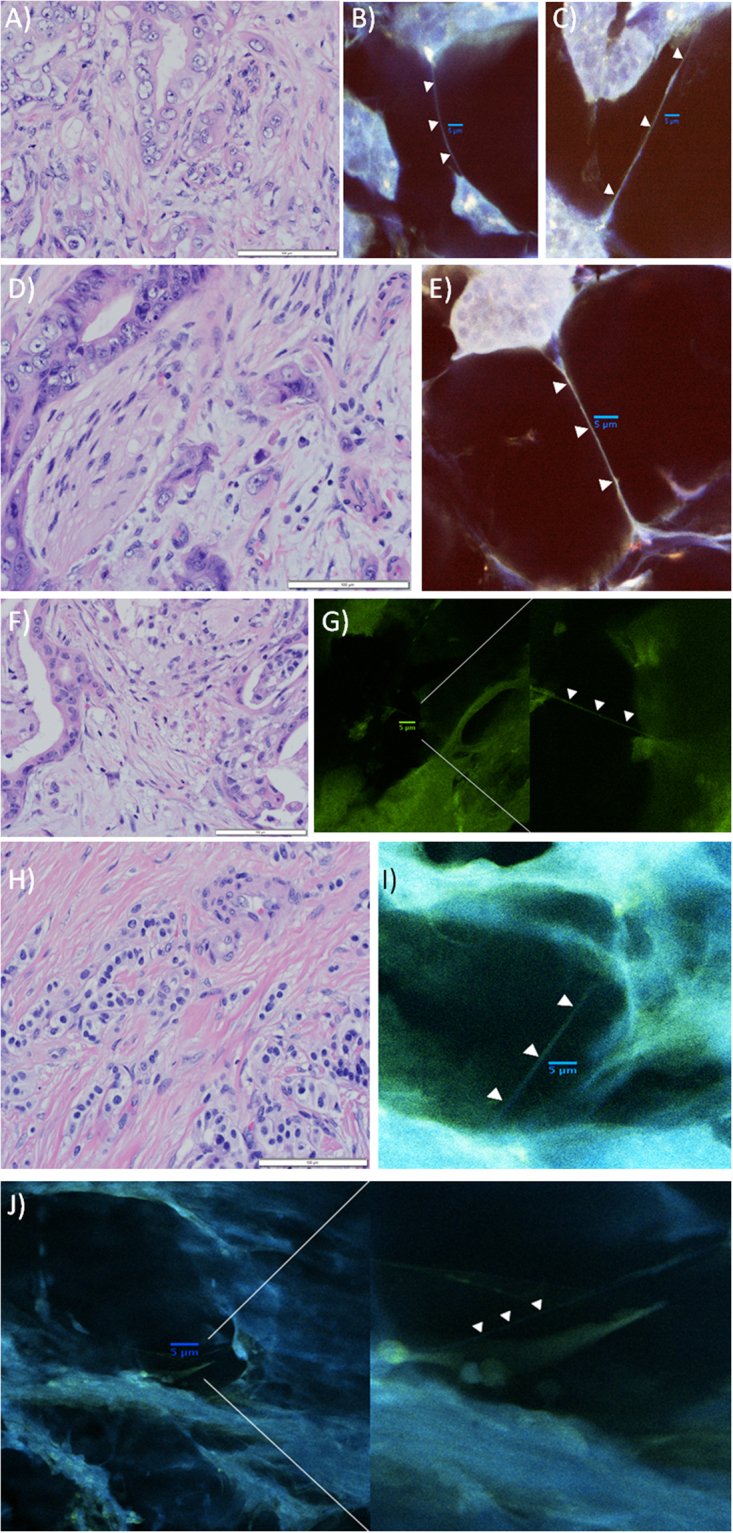
Figure 2.

Examples of 3-dimensional imaging revealing TNTs in pancreatic cancer tissue from three additional patients (two with pancreatic adenocarcinoma, one with pancreatic neuroendocrine tumor), using modified techniques intended to improve identification of TNTs amidst the dense stroma. All of these confocal images were acquired using Nikon A1R Multiphoton confocal microscope at 25x with a water immersion objective lens. Images from the tumor from the second patient are shown in panels A–E; F & G are from the third patient; (H–J) are from the fourth patient. Images of the tumor from the first patient cited in the text are shown in Fig. 1. (A) Hematoxylin and Eosin (H&E) stain of resected pancreatic adenocarcinoma from a 82 year-old male patient, demonstrating islands of malignant cells separated by cellular stroma with moderate collagen deposition, characteristic of this form of cancer (40x objective). The tumor was a 1.2 cm hypoechoic mass in the pancreatic head. The patient received initial treatment with neoadjuvant (preoperative) gemcitabine chemotherapy, followed by pancreaticoduodenectomy (Whipple procedure). Prior to starting adjuvant (post-operative) chemotherapy treatment, he was found to have new liver lesions that were confirmed by biopsy to be indicative of rapid recurrence of a particularly aggressive tumor. Scale bar = 100 μm. (B) Confocal imaging of the same tumor revealed TNTs connecting individual or groups of malignant cells. The tumor was sectioned into 100 μm thick slices using a microtome; these sections were stained using 0.5 μm MitoTracker Orange and 0.12 μm Hoechst nuclear dye (no Triton-X was used in preparation of this section). Scale bar = 5 μm. (C) A TNT connecting two islands of pancreatic carcinoma cells can be visualized using confocal imaging. This section was prepared using Triton-X with the same stains as used for the image in B. Scale bar = 5 μm. (D) Another H&E stained image of the same resected tumor (40 × objective), depicting perineural invasion by two malignant glands. Additional islands of malignant cells are separated by a large amount of dense cellular and collagenous stroma. Scale bar = 100 μm. (E) Confocal image depicting a long TNT connecting an island of malignant pancreatic cells to another group of cells at long-range. In contrast to panel D, this image exemplifies the fact that TNTs are not visualized in two-dimensional imaging using standard histopathology preparation techniques, but they can be visualized following a more deliberate and meticulous preparation protocol and approach to confocal imaging as described here. Scale bar = 5 μm. (F) H&E stained image of a second tumor, a moderately differentiated pancreatic head adenocarcinoma resected from a 75 year-old male patient. The tumor extended beyond the pancreas and invaded the duodenal wall and peripancreatic adipose tissue (40 × objective). The morphology is similar, showing malignant glands scattered throughout copious desmoplastic stroma. Scale bar = 100 μm. (G) Confocal imaging of the tumor from panel F. The tumor was sectioned into 300 μm slices, stained with 1.98 μm Phalloidin and 0.12 μm Hoechst dye, and imaged using 40 z-stacks (z-stack step size 0.3 μm). The panel on the right is a close-up of the image shown in the left panel; the TNT was initially difficult to visualize amidst a densely desmoplastic stromal microenvironment. Scale bar = 5 μm. (H) H&E stained image from a 66 year-old woman with a low-grade neuroendocrine tumor of the pancreas. The tumor invaded the ampulla and the duodenal wall in the setting of chronic pancreatitis, with evidence of lymphovascular and perineural invasion on histopathologic examination. Small alveoli of neuroendocrine carcinoma cells are showing streaming through a densely collagenous stroma. Scale bar = 100 μm. (I) Confocal imaging of the pancreatic neuroendocrine tumor. Tumor specimen was sectioned into 300 μm slices, stained with 2.97 μm Phalloidin and 0.12 μm Hoechst dye. Scale bar = 5 μm. (J) Additional image of the neuroendocrine tumor shown in panels H and I, shown in a higher-magnification view in the panel on the right. Scale bar = 5 μm.
