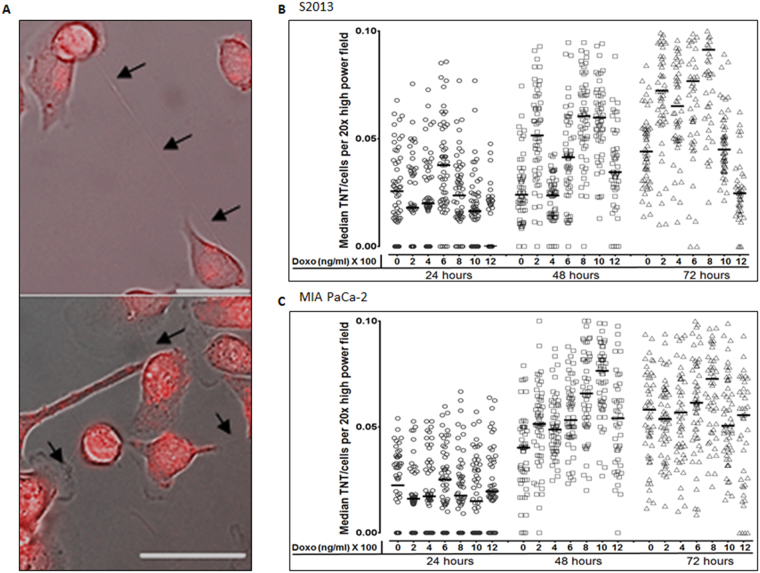
Figure 4.
Variable dose-dependent response of TNTs forming after exposure to the chemotherapeutic drug doxorubicin. (A) Representative images of TNTs transmitting autofluorescing (red) doxorubicin between S2013 cells. Images were taken using a Zeiss Axio widefield microscope. Scale bars = 50 μm. (B,C) Scatter-plot graph depicting the median number of TNTs/cell (TNT index) over time, comparing results for the S2013 (Panel B) and MIA PaCa-2 (Panel C) cell lines after exposure to six concentrations of doxorubicin. This experiment was done in triplicate, with a sample size of 18 fields of view per dose/per time point.

