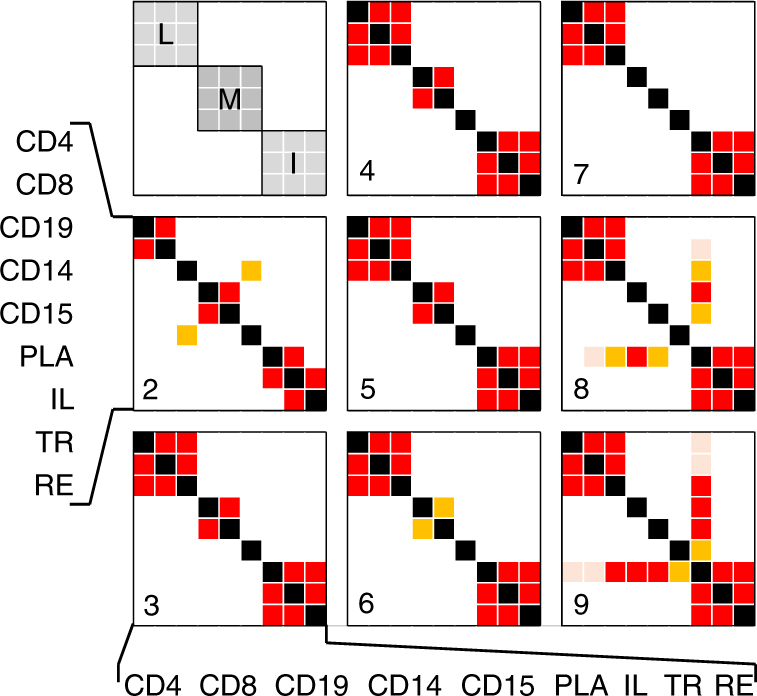
Fig. 5.

Significance of the excess sharing of cRM between cell types. (red: p < 0.0002 (Bonferroni corrected 0.0144), orange: p < 0.001 (0.072), rose: p < 0.01 (0.51)). The numbers in the lower-left corner of the squares indicate which cRM were used for the analysis: (2) cRM affecting no more than two cell types, (3) cRM affecting no more than three cell types, etc. The upper-left square indicates the position of the lymphoid cell types (L)(CD4, CD8, CD19), the myeloid cell types (M)(CD14, CD15, PLA), and the intestinal cell types (I)(IL, TR, RE). For each pair of cell types i and j, we computed two p values, one using i as reference, the other using j as reference (Methods). Pairs of p values were always consistent
