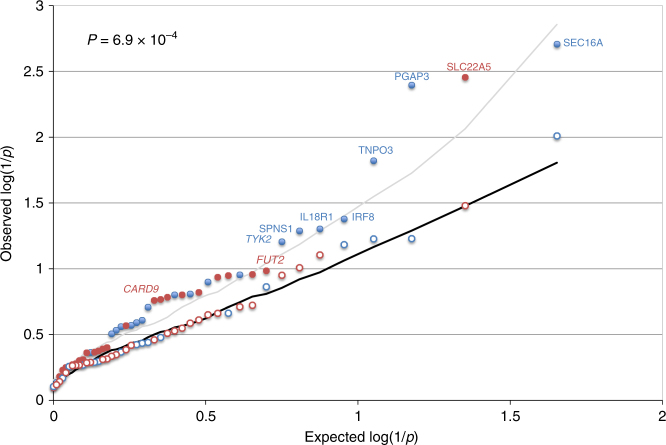
Fig. 9.
QQ-plot for the gene-based burden test. Ranked log(1/p) values obtained when considering LoF and damaging variants (full circles), or synonymous variants (empty circles). The circles are labeled in blue when the best p value for that gene is obtained with CAST, in red when the best p value is obtained with SKAT. The black line corresponds to the median log(1/p) value obtained (for the corresponding rank) using the same approach on permuted data (LoF and damaging variants). The gray line marks the upper limit of the 95% confidence band. The name of the genes with nominal p value ≤0.05 are given. Known causative genes are italicized. The inset p value corresponds to the significance of the upwards shift in log(1/p) values estimated by permutation

