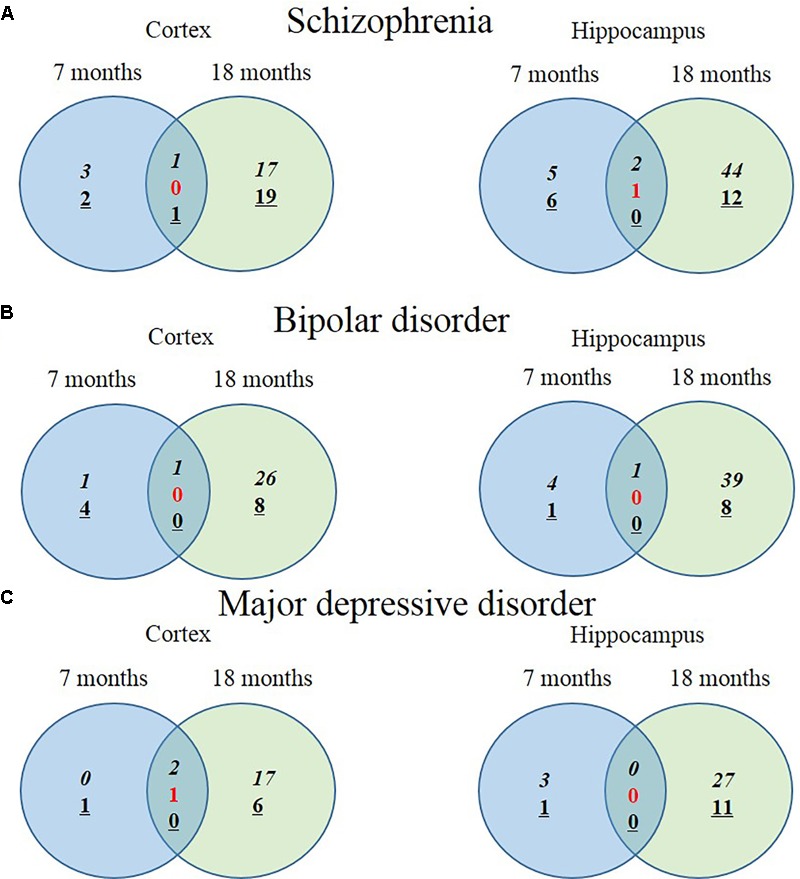
FIGURE 4.

Venn diagram displaying numbers of upregulated and downregulated SCZ-associated genes in AD animal model. The left Venn diagrams show differently expressed cortical mRNAs of AD mice compared to control mice and the right Venn diagrams show differently expressed hippocampal mRNAs of AD mice compared to control mice (P-value < 0.05, Fold change > 1.3). (A) The number of significantly altered genes within five GO terms associated with SCZ. (B) The number of significantly altered genes within four GO terms associated with BIP. (C) The number of significantly altered genes within five GO terms associated with MDD. Italicization denotes the number of up-regulated genes and an underline denotes the number of down-regulated genes. Numbers in red indicate the number of contra-regulated genes that are upregulated in one group and downregulated in another group.
