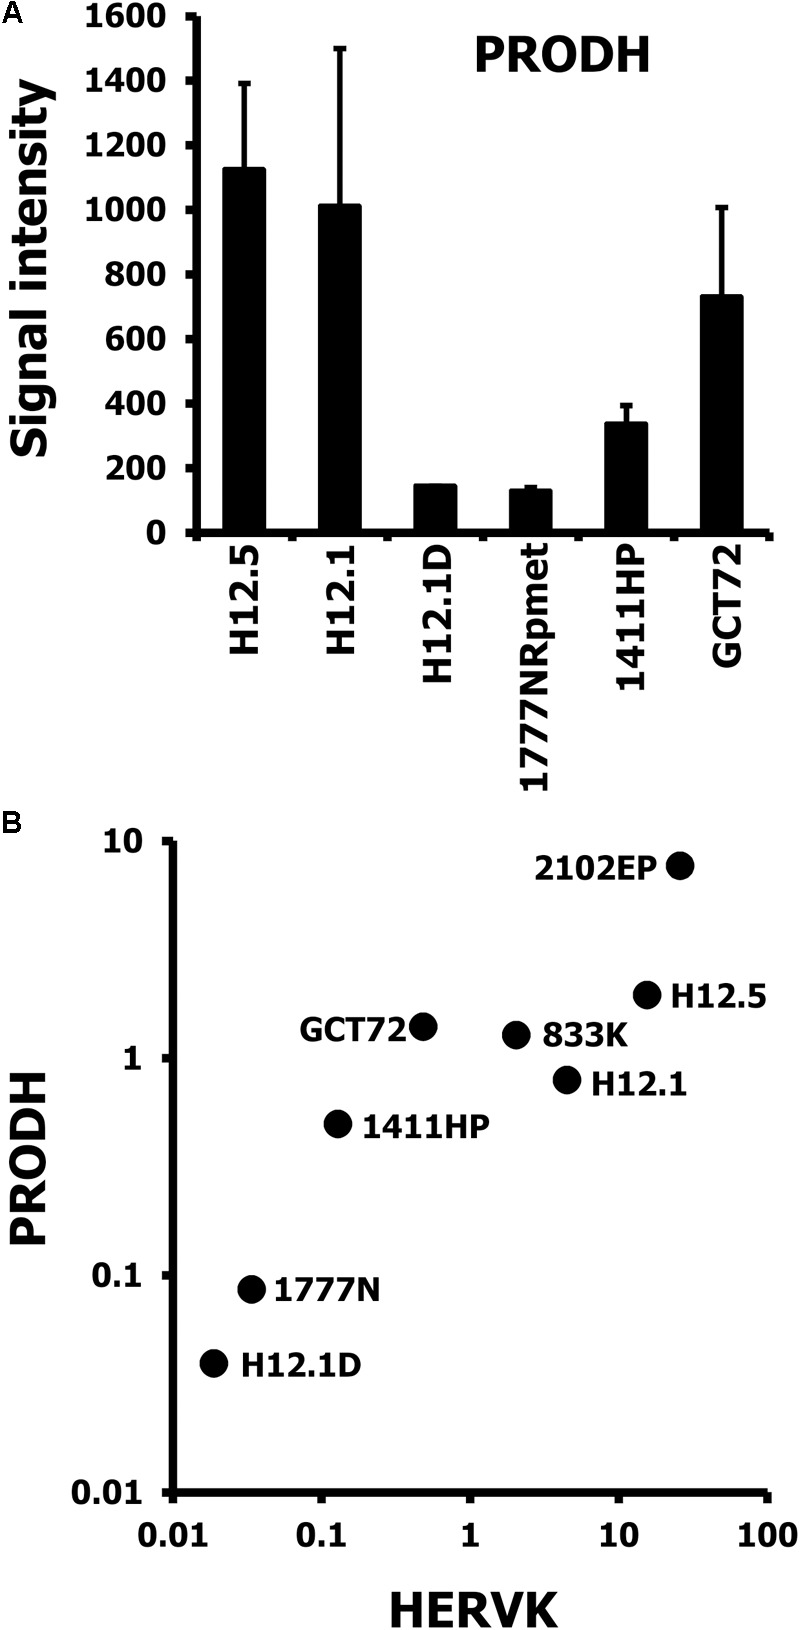
FIGURE 6.

Correlative expression of HERVK and PRODH in GCT cells. (A) Gene expression in GCT cell lines was assessed by DNA microarray analysis. Two independent samples per cell line were analyzed. Presented are signal intensities (arbitrary units) for probe sets with specificity for PRODH as means ± SD. (B) Presented are results from quantitative RT-PCR analysis with primers specific for HERVK and PRODH. cDNA was prepared from GCT cell lines and β-actin was used as house-keeping control. Two additional cell lines (2102EP, 833K), which represent the undifferentiated, pluripotent EC cell type were included to support the correlation and to analyze differences among this group of GCT cells.
