Figure 2.

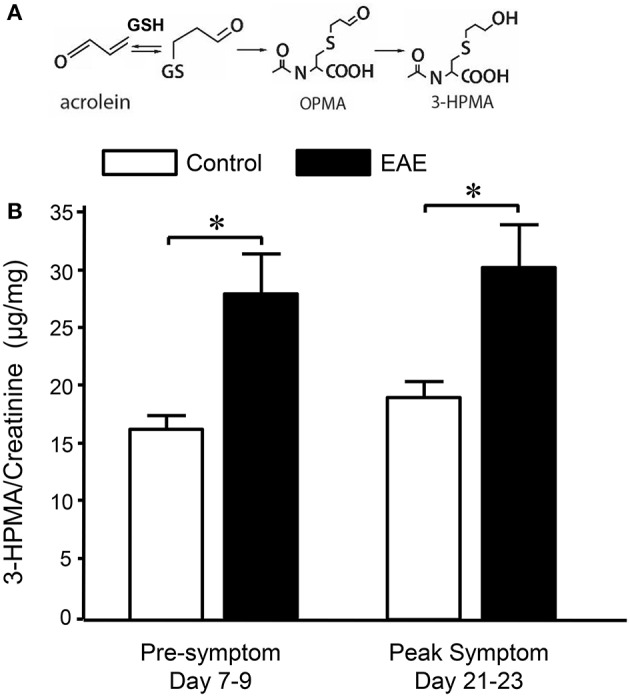
Determination of acrolein concentration through urine 3-HPMA measurement in control and EAE mice during pre or peak symptomatic stage. (A) Chemical reaction of acrolein with glutathione (GSH) and production of subsequent metabolites OPMA and 3-HPMA. (B) Bar graph depicts the ratio of 3-HPMA and creatinine measured in urine of control and EAE mouse. Urine samples were collected approximately 7–9 days and 21–23 days after MOG injection in EAE mouse which correspond to pre and peak symptomatic stage (see also Figure 1). Urine samples were also collected from age matched control mice at similar time periods. Each urine sample represents an accumulative volume of a 24 h period. Note the increase of 3-HPMA in urine in EAE mice in both pre and peak symptomatic periods when compared to control group (*P < 0.05 when compared to control, ANOVA and post-hoc Newman-Keul's test). N = 9 in each group of 3-HPMA measurement in urine. Data expressed as mean ± SEM.
