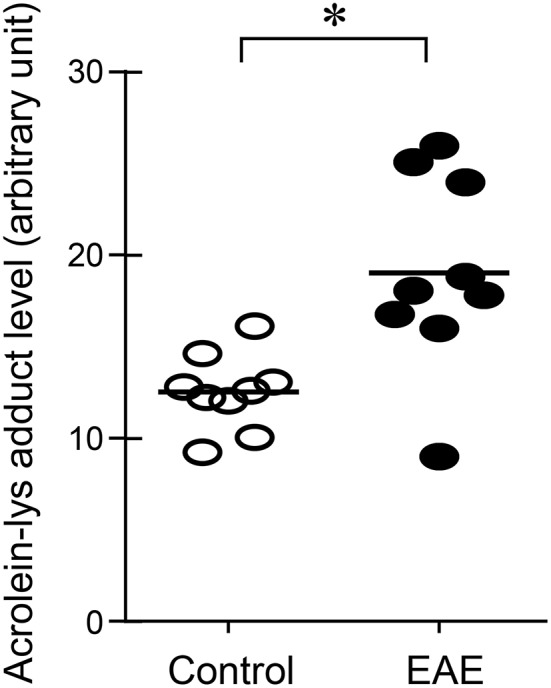
Figure 3.

Determination of acrolein changes in spinal cord tissue by immunoblotting in EAE mice. The acrolein-lysine adducts in control and in EAE were detected using Bio-Dot SF microfiltration apparatus. Band intensities were analyzed using image J (NIH) and expressed in arbitrary units. Note the scatter plot demonstrated an increase of acrolein-lysine adducts in EAE. (*P < 0.01 when compared to control, t-test). N = 9 in each group of acrolein measurement in tissue.
