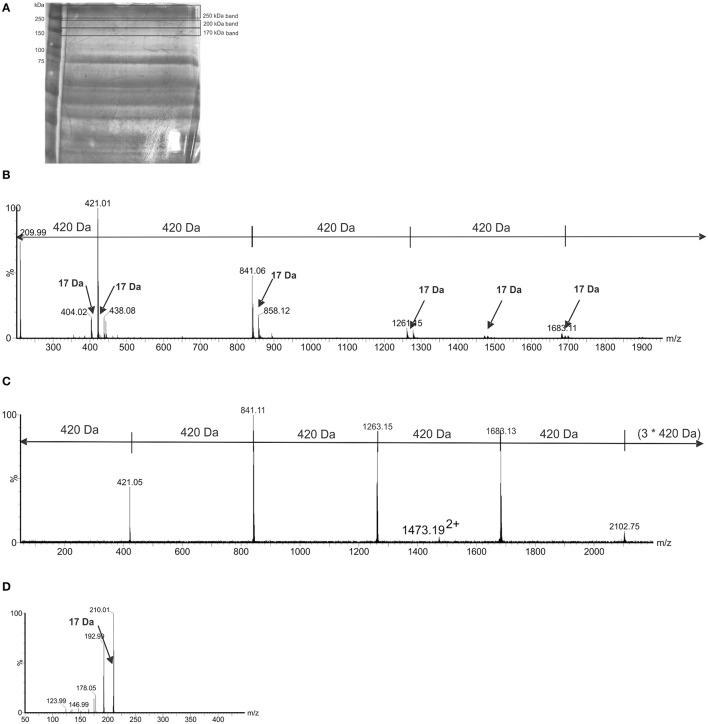
Figure 4.
Mass-spectrometry (MS) of high molecular size putative CLC bands excised from LVSΔWbtI_P10 1 M urea extract. (A) 8% SDS-PAGE of the CLC extracted from WbtIG191V_P10 CLC with 1 M urea and stained with StainsAll/silver. The extract was concentrated through a 100-kDa filter and bands indicated by black lines were excised and analyzed by MS; (B) a LC-MS trace from tryptic digest of the 200-kDa and 170-kDa gel bands showed a 420-Da repeating unit, with the number of 420-Da units/chain lengths being variable. There was evidence of a 420-Da unit in the band/smear >250-kDa, but the longer chains were not observed. In addition to the major ions, observed at 420 Da intervals, minor ions were observed, corresponding to the addition and loss of a 17-Da ammonia molecule; (C) a MS/MS of m/z 16822+, showing fragment ions at intervals of 420 Da; D, MS/MS spectrum of 421+, an ion putatively corresponding to the submit mass of the observed chains. Fragment ions were observed at m/z 210, 192, 178, 146, and 123. A loss of 17 Da, likely corresponding to ammonia, was observed.

