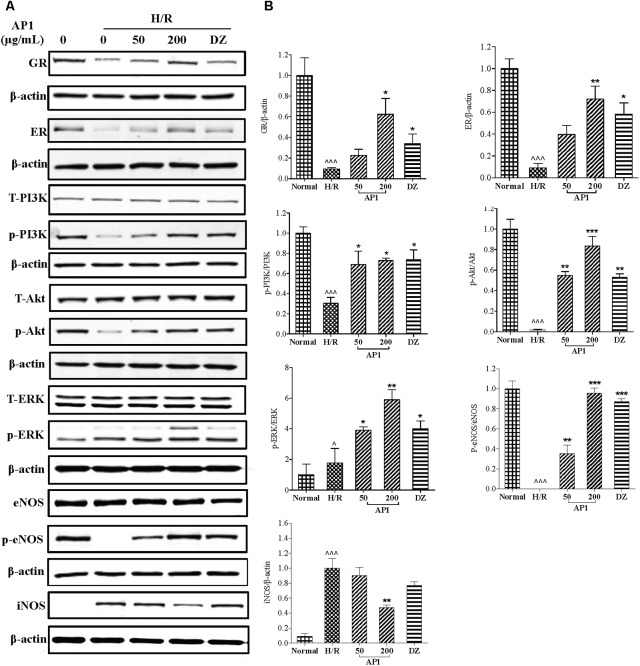
FIGURE 5.
Effect of AP1 on GR, ER/RISK/eNOS pathway of H9c2 cell exposed to H/R. (A) Western-blot analysis was performed by the antibody specific to GR, ER, ERK1/2 or phosphorylated ERK1/2, PI3K or phosphorylated PI3K, Akt or phosphorylated Akt, eNOS or phosphorylated eNOS and iNOS. (B) Quantitative analyses for protein expression. Data are presented in mean ± SD of three independent experiments. ˆ P < 0.05 vs. Normal, ˆˆˆP < 0.001 vs. Normal, ∗P < 0.05 vs. H/R, ∗∗P < 0.01 vs. H/R, ∗∗∗P < 0.001 vs. H/R.

