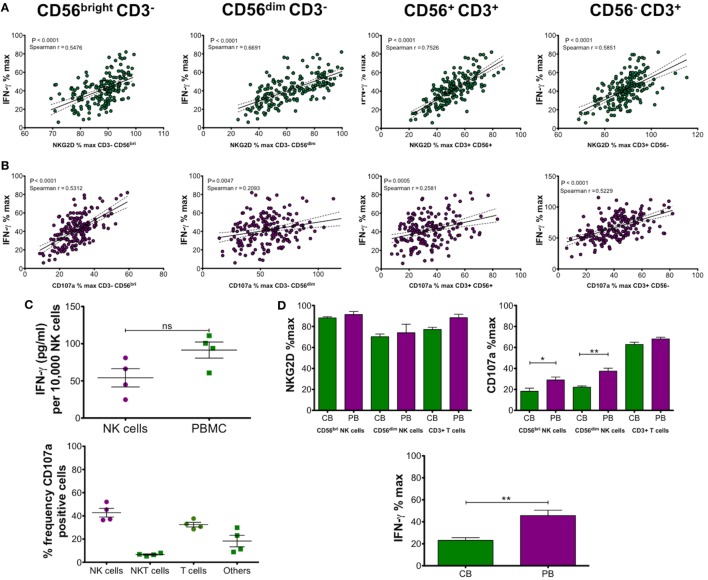
Figure 3.
(A,B) Correlation and linear regression analysis of NK group 2, member D (NKG2D) and CD107a expression on CD56bright CD3−, CD56dim CD3− natural killer (NK) cells, CD56+ CD3+ NKT cells, or CD56− CD3+ T cells with IFN-γ production. Peripheral blood mononuclear cells (PBMCs) were incubated with 50% cord blood plasma (CBP) (n = 181) or media only for 48 h and then stimulated with PMA and ionomycin. IFN-γ in culture supernatants was measured by ELISA and expression of CD107a and NKG2D on the different cell types was measured by flow cytometry. (C) IFN-γ production by isolated NK cells or PBMCs was measured after CBP incubation and stimulation with PMA and ionomycin. The upper graph shows a comparison of isolated NK cells with PBMCs after calculation of IFN-γ detected by ELISA (pg/ml)/10,000 NK cells. The lower graph shows relative frequencies of CD107a-positive CD56+CD3− NK cells, CD56+ CD3+ NKT cells, and CD56− CD3+ T cells detected by flow cytometry. (D) Comparison of cord blood (CB) and adult peripheral blood (PB) derived mononuclear cells after incubation with equivalent CBP for 48 h and PMA/ionomycin stimulation (n = 7). NKG2D and CD107a expression relative to media only controls was measured by flow cytometry and IFN-γ detected by ELISA. Each experiment was repeated with four different PBMC donors or cord blood units and data points represent donor means. P-values for Spearman r correlations are indicated (A,B). Statistical significance (C,D) was determined by Mann–Whitney test ± SEM (*P ≤ 0.05 and **P < 0.01).

