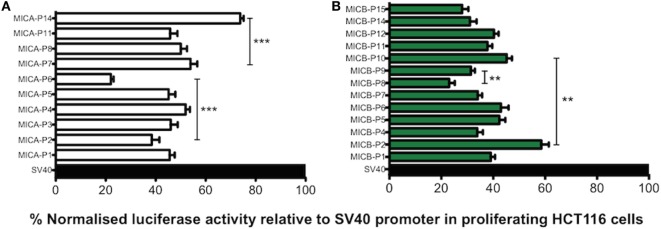
Figure 7.
Transcriptional analysis of MHC class I-related chain A (MICA) and MHC class I-related chain B (MICB) promoter regions in proliferating HCT116 cells. Normalised percent luciferase activity relative to SV40 control plasmid transfection is shown. Assay conditions were performed in triplicate with three independent preparations of plasmid construct DNA and repeated for a total of four independent experiments. (A) MICA promoter driven luciferase transcription relative to SV40 promoter in proliferating HCT116 cells 24 h post-transfection. (B) MICB promoter driven luciferase transcription relative to SV40 promoter in proliferating HCT116 cells 24 h post-transfection. Statistical analysis was performed using Mann–Whitney test ± SEM (**P < 0.01 and ***P < 0.001).

