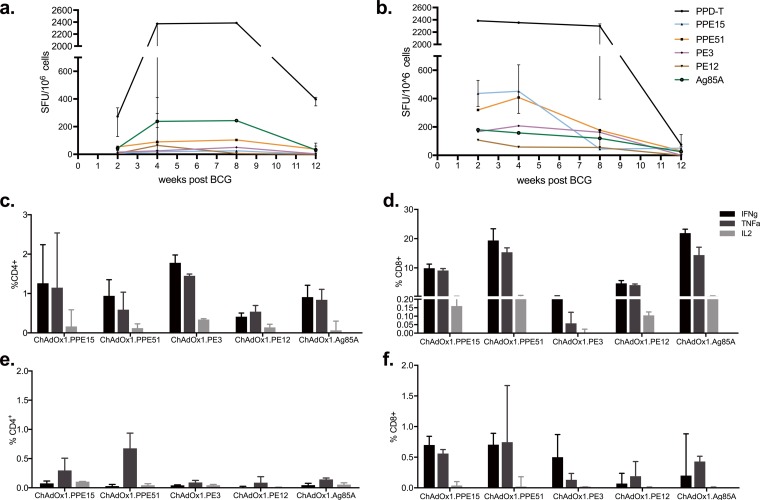
FIG 1.
Antigen-specific responses after BCG and ChAdOx1 immunizations. (a and b) Splenocytes from BCG-vaccinated BALB/c (a) and C57BL/6 (b) mice were stimulated with PPE51, PPE15, PE3, or PE12, and IFN-γ production was measured at different time points postvaccination using an ELISpot assay. Stimulations with Ag85A and PPD-T were used as positive controls. Each symbol represents the median response (in number of spot-forming units [SFU]/106 cells) for three animals, and the error bars represent the range of values. (c to f) CB6F1 mice were vaccinated with a single intranasal administration of ChAdOx1 expressing the four selected antigens; the percentage of antigen-specific CD4+ or CD8+ T cells expressing IFN-γ, TNF-α, and IL-2 was measured in the lungs (c and d) and spleen (e and f). The bars represent the median response of five animals, and error bars indicate the interquartile range. Data are representative of those from two independent experiments.

