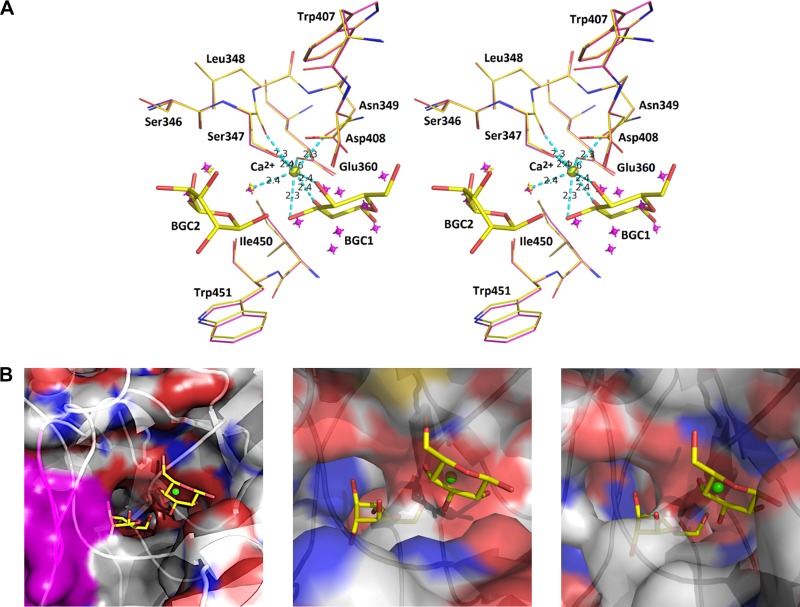
FIG 7.
(A) Stereo diagram of the interaction of BGC1 and BGC2 in the vicinity of the Ca2+ (yellow) binding site. The superposed native structure and its displaced water molecules are shown in magenta. (B) Surface plots highlighting the binding pocket, where for GbpC the loop region of residues 410 to 418 is highlighted in magenta. For AgI/II and SspB these binding pockets are very different and would pose steric hindrances for the glucose molecules, thus explaining the propensity for GbpC to specifically adhere to dextran.

