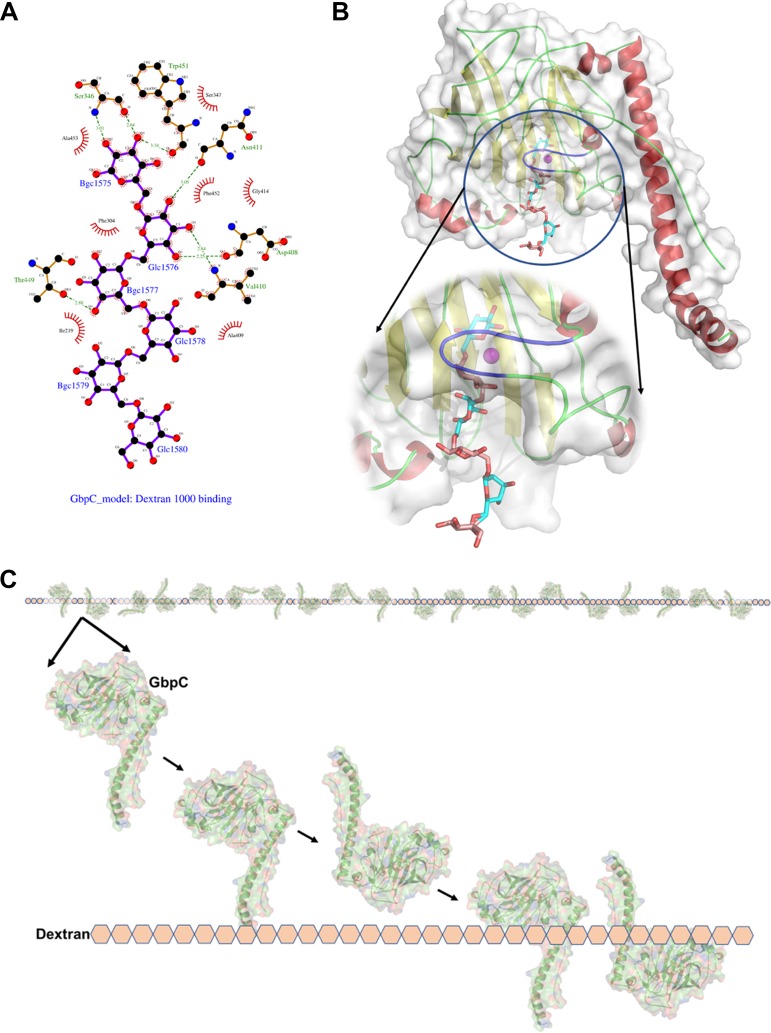
FIG 8.
Based on positions of BGC1 and BGC2 in the complex crystal structure, we have modeled dextran (6 glucose units) into the binding site. (A) Interactions of this modeled dextran with GbpC. (B) The loop region of residues 410 to 418, highlighted in purple, hovers over the Ca2+ site, which hosts the dextran (glucan) binding site. This loop region is highly flexible in the structure and could open and close to accommodate the glucose molecules thus locking into place. (C) The model for the interaction of GbpC with dextran (glucose lattice) based on ITC and crystal structure.

