FIG 2.
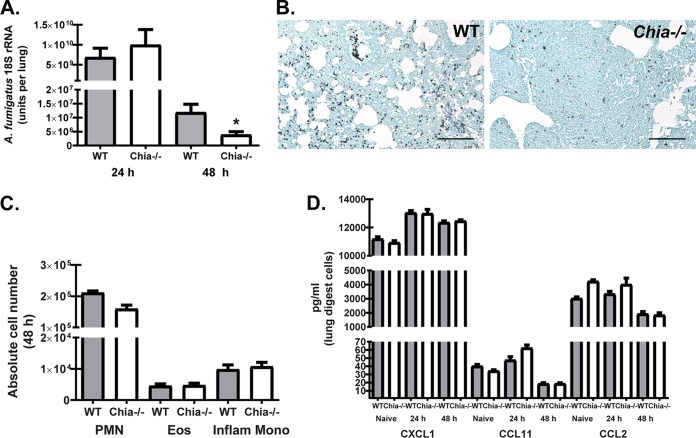
Acidic mammalian chitinase negatively affects A. fumigatus lung clearance. (A) C57BL/6 wild-type (WT) and acidic mammalian chitinase-deficient (Chia−/−) mice were challenged intratracheally with A. fumigatus conidia, and at 24 and 48 h postexposure, lung fungal burdens were assessed by real-time PCR analysis of A. fumigatus 18S rRNA levels. Shown are cumulative data from three independent studies (n = 4 to 6 mice per group, per study). Data are expressed as mean A. fumigatus 18S rRNA levels and standard errors of the means. (B) Representative GMS-stained lung sections from wild-type (left) and Chia−/− (right) mice challenged intratracheally with A. fumigatus conidia for 48 h. Original magnification, ×200. Bar, 100 μm. (C) WT and Chia−/− mice were challenged with A. fumigatus, and 48 h after exposure, the right lungs were collected, enzymatically digested, Fc blocked, stained with a live/dead staining kit, and thereafter stained with fluorochrome-conjugated antibodies against the following cell surface markers: neutrophils and eosinophils (Eos) (gated on CD11b+ cells followed by Ly6G+ cells as neutrophils and Siglec-F+ cells as eosinophils) and inflammatory monocytes (Inflam Mono) (gated on CD11b+ Ly6C+ cells followed by gating on CCR2+ cells). Cumulative flow cytometric data are from two independent studies (n = 2 to 4 mice per group, per study). Data are expressed as absolute numbers of live cells in lung digests. PMN, polymorphonuclear leukocytes. (D) WT and Chia−/− mice were challenged intratracheally with A. fumigatus conidia, the right lungs were collected 24 h and 48 h after exposure and enzymatically digested, and unfractionated lung cells were cultured in triplicate for 24 h. The right lungs from naive WT and Chia−/− mice were also collected and processed to examine baseline mediator levels. CXCL1/KC, CCL11/eotaxin, and CCL2/MCP-1 levels in clarified coculture supernatants were quantified by Bio-Plex. Shown are cumulative data from three independent studies (n = 1 to 2 mice per group, per study). For all graphs, * represents a P value of <0.05 (unpaired two-tailed Student's t test).

