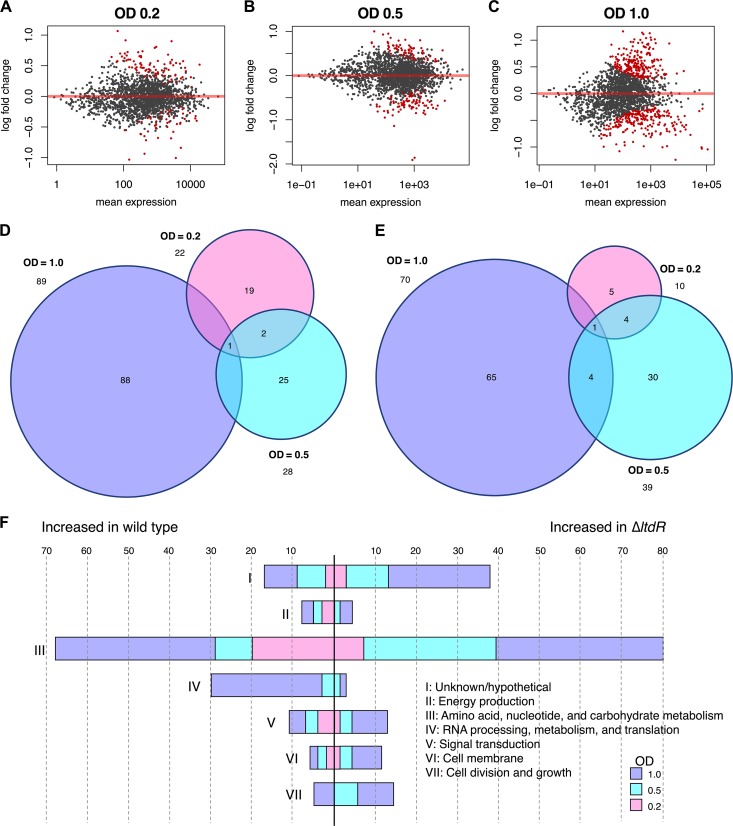
FIG 7.
RNA sequencing to identify LtdR-regulated processes. (A to C) MA plots highlighting genes differentially expressed between WT GBS and the ΔltdR mutant at different growth phases. Significantly differentially expressed genes (adjusted P < 0.1) are indicated in red. An OD600 of 0.2 (A), an OD600 of 0.5 (B), and an OD600 of 1.0 (C) correspond to late lag phase, exponential phase, and early stationary phase, respectively. (D and E) Venn diagrams of genes expressed at significantly (adjusted P < 0.05) higher levels in WT GBS than in the ΔltdR mutant (D) and transcripts that were present at significantly larger amounts in the ΔltdR mutant strain than in the WT (E). (F) Significantly differentially expressed genes (adjusted P < 0.05) were classified according to the cluster of orthologous groups (COG) of genes.

